
The first time I hit FATAL ERROR: Reached heap limit Allocation failed - JavaScript heap out of memory in production, the fix looked obvious: raise the heap and redeploy. That bought us six hours. Then the pod died again, slower this time, and the graph told the truth. We had not fixed memory. We had given a leak more room to walk.
This guide is the fix path I use now for JavaScript heap out of memory in Node.js: get the service back if it is down, match V8’s heap to the container budget, separate heap from RSS, capture evidence before the restart, and only then decide whether the problem is a real leak, an under-sized build job, or a legitimate workload that needs a bigger process.
What the error actually means
Node runs JavaScript objects inside V8’s managed heap. When V8 cannot reclaim enough memory for new allocations, the process stops with the heap error. The Node CLI docs list --max-old-space-size as the flag for old-space size in MiB, which is the part of the heap most long-lived objects end up using.
The trap is that the V8 heap is not the whole process. A Node process also uses native memory, buffers, compiled code, addon memory, thread stacks, OpenSSL, zlib, image libraries, and memory-mapped files. Node exposes the split through process.memoryUsage(): heapUsed and heapTotal are V8 heap signals, while rss, external, and arrayBuffers help explain memory outside ordinary JavaScript objects. A container can die from RSS while V8 still looks reasonable.
setInterval(() => {
const m = process.memoryUsage();
console.log({
rssMb: Math.round(m.rss / 1024 / 1024),
heapUsedMb: Math.round(m.heapUsed / 1024 / 1024),
heapTotalMb: Math.round(m.heapTotal / 1024 / 1024),
externalMb: Math.round(m.external / 1024 / 1024),
arrayBuffersMb: Math.round(m.arrayBuffers / 1024 / 1024),
});
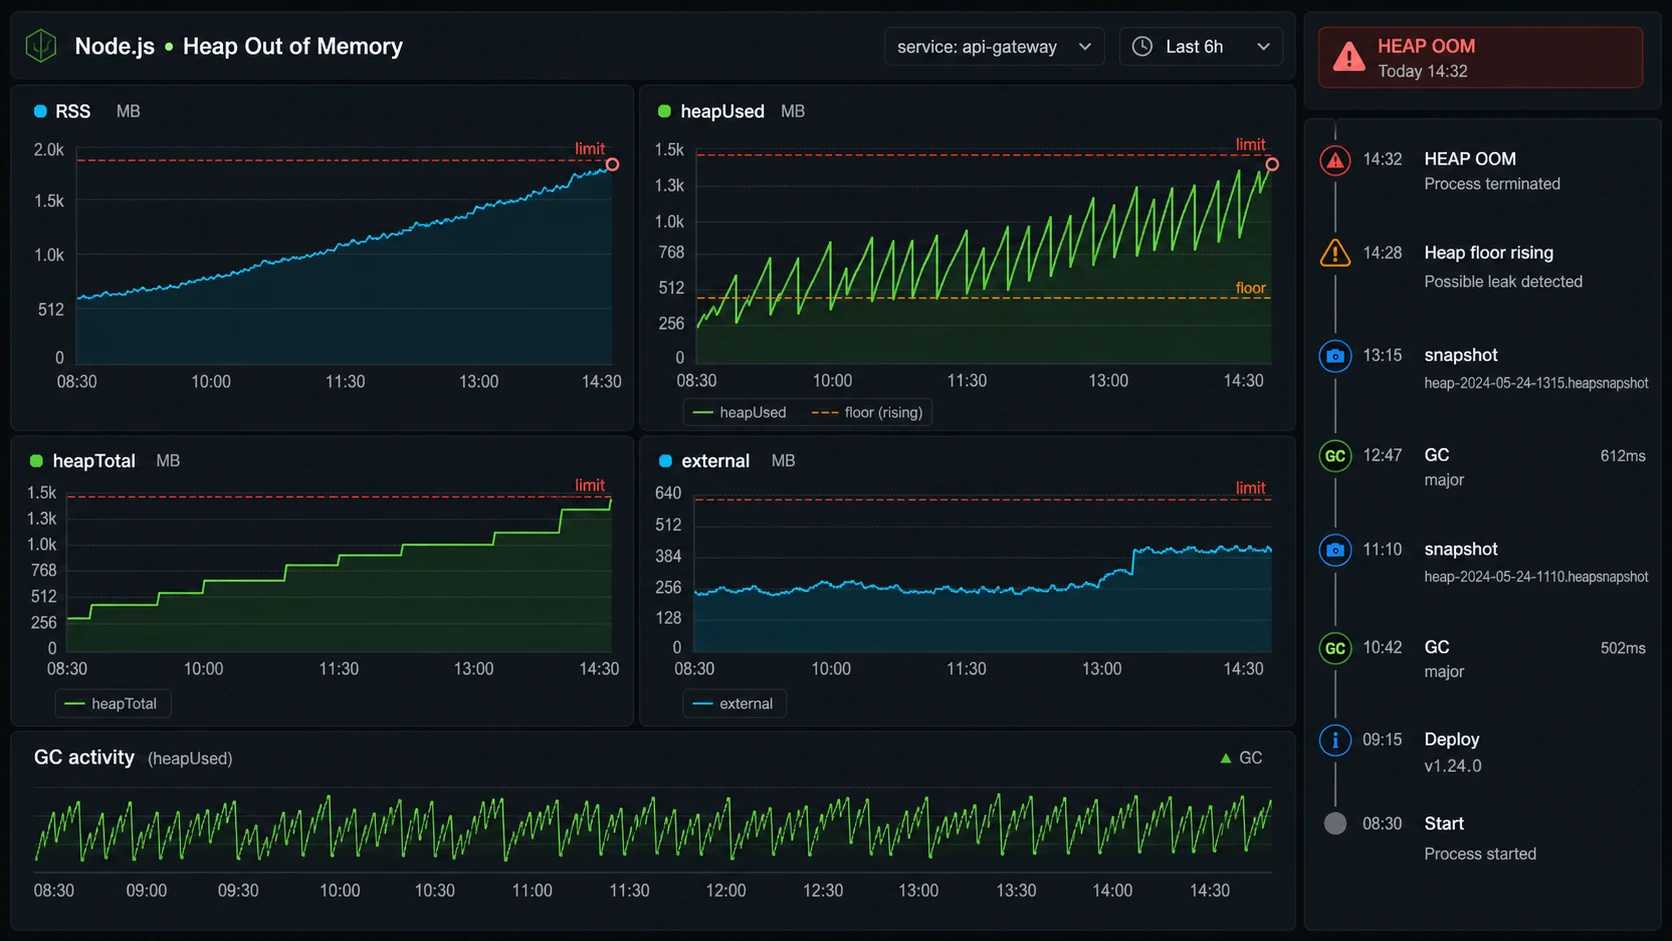
}, 30_000);If heapUsed rises forever, I suspect retained JavaScript objects. If rss rises while heapUsed stays flat, I look at buffers, native libraries, streams, compression, file uploads, or an addon.
The safest heap number
Do not set --max-old-space-size equal to the container limit. Leave headroom. My default is 65-75 percent of the container memory limit for old-space, lower if the service handles large buffers or image/file work.
| Container memory | Old-space starting point | Why |
|---|---|---|
| 512 MiB | 256-320 MiB | Small APIs, plenty of native overhead risk |
| 1 GiB | 640-768 MiB | Typical Express/Fastify API |
| 2 GiB | 1280-1536 MiB | Heavier API, GraphQL, larger response shaping |
| 4 GiB | 2560-3072 MiB | Build jobs, workers, batch transforms |
For Docker, make the relationship visible instead of hiding it in a package script:
ENV NODE_OPTIONS="--max-old-space-size=3072"
CMD ["node", "dist/server.js"]
For Kubernetes, keep the V8 heap below the memory limit:
env:
  - name: NODE_OPTIONS
    value: "--max-old-space-size=1536"
resources:
  requests:
    memory: "1Gi"
    cpu: "500m"
  limits:
    memory: "2Gi"
    cpu: "1"
If the pod exits with code 137, Kubernetes killed the process because the container crossed its memory limit. The Kubernetes docs on container memory requests and limits are the reference I use when checking whether the process crossed the pod budget rather than V8 old-space. That is different from V8 throwing a heap error. The fix path overlaps, but the evidence is different.
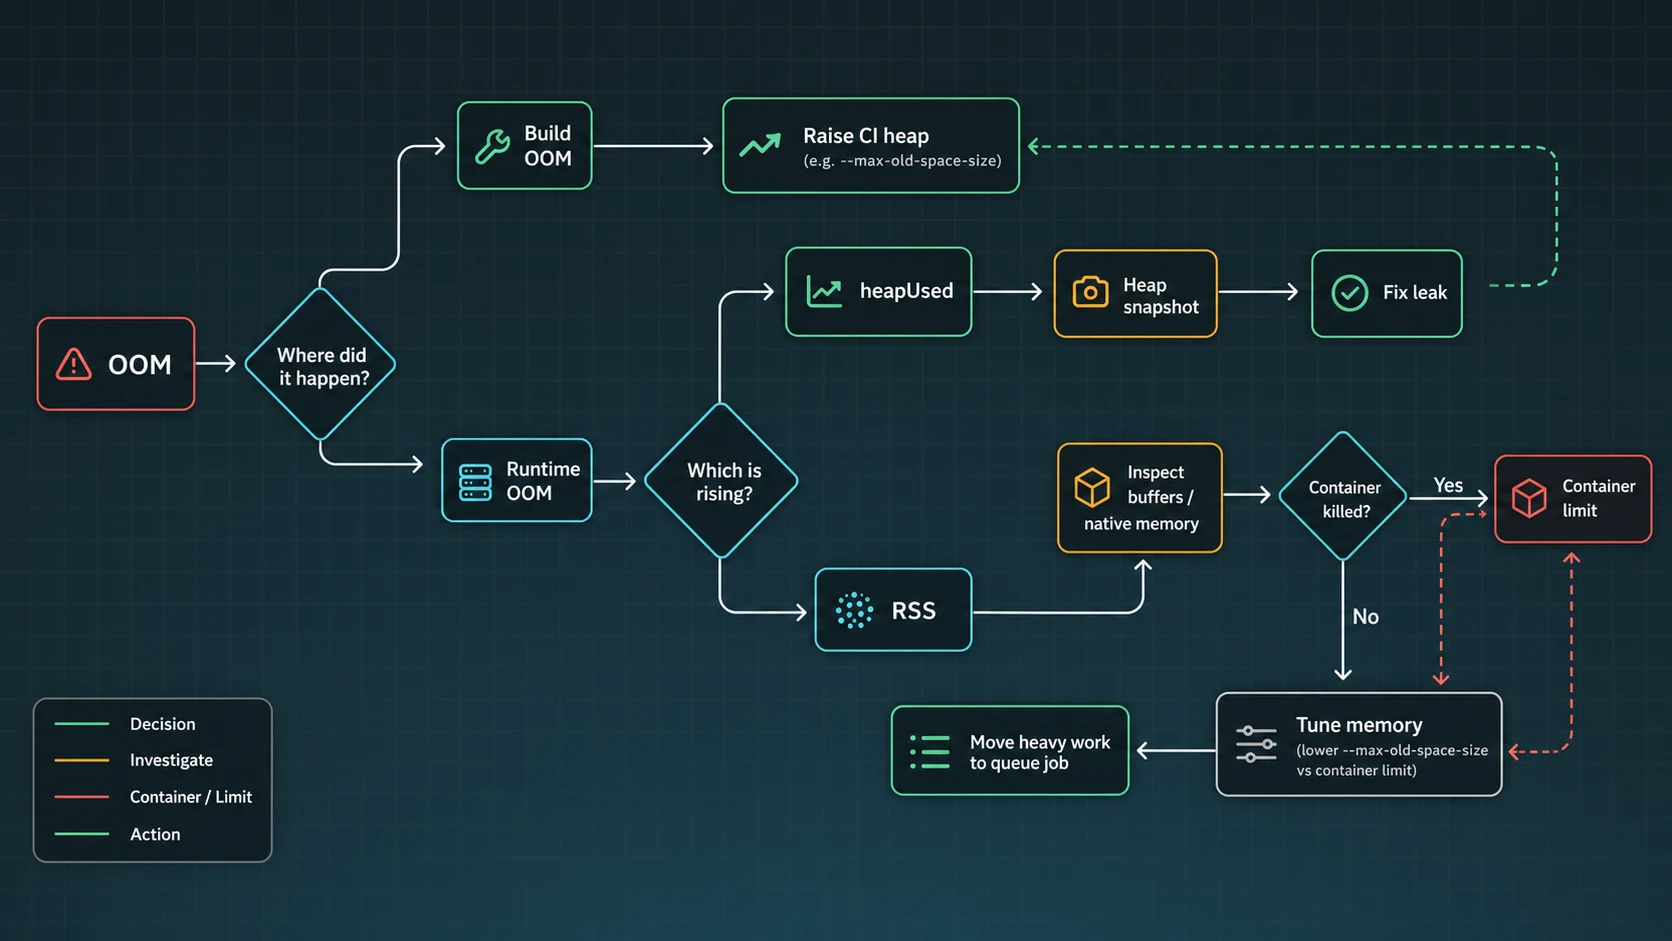
Build-time OOM vs runtime OOM
Frontend builds, TypeScript compilation, bundlers, and monorepo tasks often need a larger heap for a short burst. I am comfortable raising memory for a build job when the graph spikes during compile and returns to zero after the process exits.
{
  "scripts": {
    "build": "NODE_OPTIONS=--max-old-space-size=4096 vite build",
    "typecheck": "NODE_OPTIONS=--max-old-space-size=4096 tsc --noEmit"
  }
}
Runtime OOM is stricter. If a server needs more heap every hour under the same traffic, I treat that as a leak until proven otherwise. The package scripts above use POSIX-style inline environment variables; on Windows runners, use cross-env or configure NODE_OPTIONS in the CI environment instead of copying that line unchanged. The longer version of the leak investigation is in the Node.js memory leak guide.
Capture evidence before the restart
When the service is already on fire, I want two things: a heap snapshot and a timeline. Node can write snapshots as the heap approaches the limit:
node
  --max-old-space-size=1536
  --heapsnapshot-near-heap-limit=3
  dist/server.js
Snapshots can contain user data. Treat them like production logs with secrets: short retention, private storage, and no Slack uploads. Once captured, compare snapshots in Chrome DevTools or another heap analysis tool. I start with retained size, object count growth, strings, arrays, maps, closures, and request-scoped objects that should have disappeared.
The leak triage I run
- Reproduce with steady input. Same request mix, same payload size, same concurrency for 20-60 minutes.
- Watch heap after GC. Sawtooth is normal. A rising floor after garbage collection is suspicious.
- Disable caches. A cache without max size looks exactly like a leak from the outside.
- Check event listeners. Repeated listeners on a shared emitter retain request state.
- Inspect queues and retries. Failed jobs, unbounded arrays, and in-memory buffers grow quietly.
- Split heap and RSS. Buffers, file uploads, compression, and native code may not show as heap growth.
If the app streams uploads or downloads, read the Node.js streams guide before blaming V8. I have seen upload routes buffer whole files, crash the pod, then get “fixed” with a 4 GB heap that still failed during a larger customer import.
The guardrails that keep OOM from becoming normal
The real fix is not one flag. It is a memory contract:
- Set container memory limits and
NODE_OPTIONStogether. - Graph RSS, heap used, heap total, external memory, restarts, and GC pressure.
- Keep file uploads and exports streaming, not buffered in arrays.
- Put max sizes on in-memory caches.
- Use background jobs for large transforms; see the BullMQ guide.
- Load test the route that allocates memory, not only the homepage.
- Capture heap snapshots only with privacy controls.
The flags I add when the incident is real
The Node CLI documentation for --max-old-space-size is the quick fix, but the diagnostic flags are what save the postmortem. I usually pair the heap limit with --heapsnapshot-near-heap-limit and a writable diagnostic directory so snapshots do not disappear into a container filesystem I cannot reach.
NODE_OPTIONS="--max-old-space-size=1536 --heapsnapshot-near-heap-limit=3 --diagnostic-dir=/var/log/node-diagnostics"
  node dist/server.js
The Node heap snapshot guide is worth reading before an outage, because snapshots can pause the process and may include sensitive data. In a live API, I prefer capturing from one replica, draining it from traffic when possible, and storing snapshots somewhere private with a short retention window.
Decision table: raise memory or fix code?
| Signal | Likely cause | Next move |
|---|---|---|
| Build dies, runtime is fine | Bundler or TypeScript needs more heap | Raise CI/build heap, keep server unchanged |
| Heap floor rises after GC | Retained JS objects | Compare snapshots and inspect retainers |
| RSS rises, heap is flat | Buffers/native/external memory | Audit uploads, streams, compression, addons |
| Only one route spikes memory | Large query/export/import | Stream, paginate, or move to a BullMQ job |
If Docker is involved, pair this with the Node.js Docker guide. If CPU and GC are also climbing, the performance checklist is the next pass.
Container memory: the number Node cannot fully budget for you
The heap flag is only one ceiling. In Docker or Kubernetes, the process also lives under a cgroup memory limit, and the kernel can kill it before Node prints a friendly JavaScript heap error. Modern Node is better at reading platform limits than old releases were, but V8 old-space is still only one part of RSS. That is why I set the Node heap below the container limit and leave room for RSS, buffers, native modules, TLS, compression, and the runtime itself.
container memory: 2048 MiB
Node old-space:   1536 MiB
headroom:          512 MiB for RSS, buffers, native memory, and spikes
If the container exits with an OOMKilled status but the V8 heap graph is flat, raising --max-old-space-size can make the problem worse. I look at RSS, external memory, upload buffers, image processing, compression, and large JSON payloads. A heap snapshot explains retained JavaScript objects; it does not explain every byte the process owns.
For production, I want a writable diagnostic directory, private snapshot storage, and a runbook that says who is allowed to download heap snapshots. The Node diagnostics docs warn that snapshots can pause the process and include sensitive data, so I treat them like incident artifacts, not casual logs.
Sources checked for this version
For this May 14, 2026 preflight, I checked the current Node CLI docs for --max-old-space-size, the Node diagnostics guide for heap snapshot risk, the Node process.memoryUsage() reference for heap/RSS fields, Kubernetes memory-limit docs for OOMKilled behavior, and current Google results around JavaScript heap OOM fixes. The practical rule in this article is intentionally conservative: raise memory only enough to restore service, then separate V8 heap growth from RSS growth before calling the incident solved.
FAQ
How do I fix JavaScript heap out of memory in Node.js?
Set NODE_OPTIONS=--max-old-space-size=4096 for the failing process, then check whether heap grows continuously. If it does, capture snapshots and fix the leak instead of only raising memory.
What value should I use for max-old-space-size?
Use MiB and leave headroom. In containers I start around 65-75 percent of the memory limit, then adjust using RSS and heap metrics.
Why does Docker kill Node even after I raise the heap?
The container limit applies to RSS, not only V8 heap. Native memory, buffers, and external allocations can push RSS over the limit.
Is this always a memory leak?
No. Build tools and legitimate batch jobs may need more heap. A long-running server with a rising post-GC floor under steady traffic is much more likely to have a leak.
Should I use PM2 cluster to avoid heap errors?
Cluster gives each worker its own heap, but it also multiplies memory and database connections. Use it for CPU/process isolation, not as a memory-leak fix.
When raising the heap is the wrong call
If the error happens during build, I raise the heap and keep the CI machine honest. If it happens in a server, I raise the heap only enough to restore service, then I hunt the growth curve. A bigger old-space value is a tourniquet. The fix is knowing what the process is retaining and why.