

The first Node.js memory leak I had to chase in production took six days to find and one line of code to fix. The app was an Express service handling about 200 req/s. Memory climbed from 180 MB at boot to 1.4 GB over twelve hours, at which point PM2 killed the worker and the cycle restarted. The leak was a Sentry breadcrumb collector with no upper bound, accumulating one entry per request. Six days, one line: maxBreadcrumbs: 50.
The hard part of memory leaks is never the fix. It is the diagnosis. The workflow below is the one I use in production: confirm there is a leak, find which object is leaking, find which code path is allocating it, and prove the patch fixed it. Tools: Node’s built-in --inspect with Chrome DevTools, clinic.js for a higher-level view, and heapdump when you need to capture a snapshot from a process you can’t attach to.
Confirm a leak before you start hunting
Half the time engineers come to me with a “memory leak,” it is a process doing exactly what it is supposed to: caching things, with the cache size bounded by something that takes a few hours to fill. A real leak grows monotonically over hours and never plateaus. Three things to check first.
1. Plot RSS over time. If you have monitoring (Datadog, New Relic, even top in a tmux), watch the resident set size over a 24-hour window. A sawtooth pattern (climbs, GC, drops) is healthy. A staircase that only goes up is a leak.
2. Check if it actually crashes. Node’s V8 heap caps at roughly 1.5 GB by default. RSS includes the heap, native bindings, and the loaded code; a 700 MB process at idle might be entirely fine. Crashes look like:
FATAL ERROR: Reached heap limit Allocation failed - JavaScript heap out of memory
 1: 0xb09980 node::Abort()
 2: 0xa1c193 node::FatalError(...)
If you see that, you have a leak. If memory grows but the process never crashes, you might have a cache or buffer doing its job.
3. Check the GC. Run with --trace-gc for an hour:
node --trace-gc dist/server.js | tee gc.logLook at the heap size after each “Mark-sweep” line. If it grows unbounded across multiple full GCs, the leak is real. If it grows then drops back, GC is doing its job and the apparent climb was incremental allocation between collections.
One caveat for Node 22+: RSS growth under sustained load in Node 22 can be V8’s page-caching optimisation, not a leak. V8 holds onto memory pages it has already used, expecting to reuse them, so RSS climbs but heapUsed stays flat. Always verify with process.memoryUsage().heapUsed, not RSS alone, before concluding you have a real leak.
Quick inline check with process.memoryUsage()
Before you attach a debugger, add three lines to your code to see if memory is actually growing:
// Add to a health endpoint or a setInterval
function logMemory(label = '') {
  const m = process.memoryUsage();
  console.log(`[memory ${label}] heapUsed=${(m.heapUsed / 1024 / 1024).toFixed(1)}MB rss=${(m.rss / 1024 / 1024).toFixed(1)}MB external=${(m.external / 1024 / 1024).toFixed(1)}MB`);
}

// Log every 30 seconds for 10 minutes while running the suspect workload
const interval = setInterval(logMemory, 30_000);
setTimeout(() => clearInterval(interval), 10 * 60_000);
If heapUsed climbs monotonically and never drops after GC cycles, you have a heap leak. If rss climbs but heapUsed stays flat, you likely have a native/external memory issue (Buffer, native bindings) — heap snapshots won’t show it.

Build a reproducible test case first
Diagnosing a leak against a running production server is painful. Before you attach a profiler to production, write the smallest possible reproduction. Here is a 20-line synthetic leak you can use to practice the diagnostic workflow:
// leak-demo.ts — run with: npx tsx leak-demo.ts
const leaks: any[] = [];
let counter = 0;

const interval = setInterval(() => {
  // Each iteration retains a 100,000-element array — never freed
  leaks.push(new Array(100_000).fill(counter));
  counter++;

  if (counter % 5 === 0) {
    const m = process.memoryUsage();
    console.log(
      `iter ${counter}: heapUsed=${(m.heapUsed / 1024 / 1024).toFixed(1)}MB rss=${(m.rss / 1024 / 1024).toFixed(1)}MB`
    );
  }

  if (counter >= 30) clearInterval(interval);
}, 50);
Run this and watch heap climb from ~7 MB at iteration 5 to ~27 MB at iteration 30 — linear growth, no plateau, no recovery. That is your textbook leak signature. Practice the snapshot workflow on this before you touch production.
Quick start: capture a heap snapshot in 5 commands
Working flow before reading the analysis sections.
node --inspect=0.0.0.0:9229 dist/server.jsFrom your laptop, open chrome://inspect, click “Open dedicated DevTools for Node,” go to the Memory tab. Take a heap snapshot. Run the suspect workload for ten minutes. Take a second snapshot. Use the dropdown above the snapshot list to switch the second one to “Comparison” mode, sort by Delta. The objects with the largest positive delta are your leak candidates.
For a process you cannot reach over a port (managed Lambda, container without an inspector port), use heapdump to write a .heapsnapshot file from inside the process:
import * as heapdump from 'heapdump';

process.on('SIGUSR2', () => {
  const file = `/tmp/${Date.now()}.heapsnapshot`;
  heapdump.writeSnapshot(file, (err) => {
    console.log(err ? `failed: ${err}` : `wrote ${file}`);
  });
});kill -USR2 $(pgrep -f 'node dist/server.js')
scp server:/tmp/1742... ~/Downloads/ # then load in Chrome DevTools Memory tabWhat is wrong with the typical “fix the memory leak” article
Five things most leak articles get wrong:
- They start with the fix patterns and skip the diagnosis. “Common leaks include unbounded Maps” is true and useless when you don’t know which Map.
- They show one tool and stop. Heap snapshots tell you what objects are retained. They don’t tell you which code allocated them. You need both views.
- They don’t validate the fix. A patched leak should produce a flat memory line; if you don’t measure post-fix, you don’t know.
- They confuse heap with RSS. Native memory leaks (libraries with C++ bindings) don’t show in heap snapshots; you need a different tool.
- They never mention the boring fixes. Most production leaks I find are unbounded caches, listener accumulation, or closures over request objects. Exotic V8 internals are vanishingly rare.
The three-snapshot technique
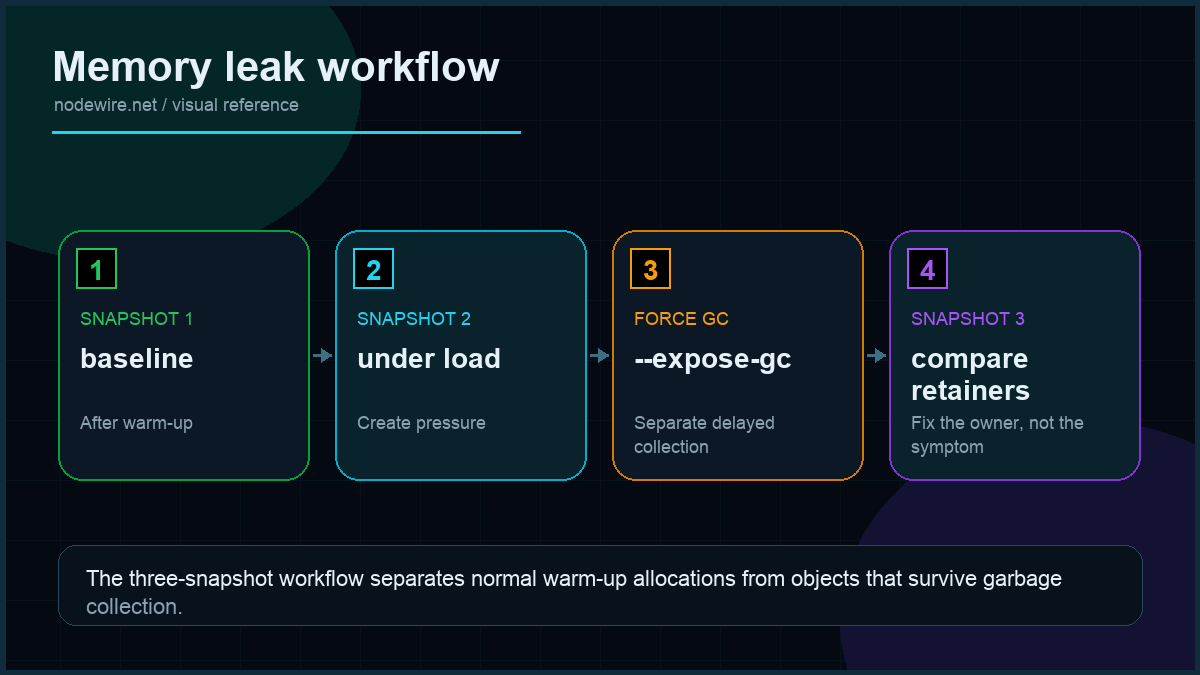
Two snapshots (baseline + after-workload) works, but it misses a subtlety: some objects grow during warm-up and then stabilise. The three-snapshot technique separates warm-up noise from genuine leaks:
- Let the service warm up — usually 2 minutes under light load. Take snapshot #1 as your baseline once memory has stabilised.
- Run the suspect workload. A hundred requests to the endpoint you think leaks, or 5 minutes of autocannon load. Take snapshot #2.
- Run an identical volume of workload again. Take snapshot #3.
Now switch snapshot #3 to “Comparison” mode against snapshot #1 (not #2). Sort by “# Delta” descending. Here is the key: any object type that grew from #1 to #2 but stayed roughly flat from #2 to #3 was probably just warm-up allocation. Any object type that grew from #1 to #2 and grew again by a similar amount from #2 to #3 is a real leak — growth is linear with traffic. The three-snapshot test makes the leak pattern undeniable.
Find which object is leaking with heap snapshots
The Comparison view in Chrome DevTools is the biggest-impact tool. Workflow:
- Boot the app. Take snapshot #1 once memory has stabilised (usually 60 seconds in).
- Run the workload that you suspect leaks. autocannon against the suspect endpoint for 5 minutes works.
- Force a full GC: in the DevTools Memory tab, click the trash-can icon. This rules out “this object would have been collected on next GC.”
- Take snapshot #2.
- Switch view to “Comparison,” set “Compared to” → snapshot #1, sort by “# Delta” descending.
The first row is what is growing. Click it; the bottom pane shows retainers — the chain of references holding it alive. Trace the chain back to a global, a closure, or a long-lived object. That is your leak.
One pattern that catches engineers off guard: the leak is not the largest object class. It is the class with the largest delta. A million Strings retained because they are keys in a Map you forgot to clean up looks like “lots of strings”; the Map itself is small. Comparison view spots it.
Reading the retainer chain
The retainer chain in the bottom panel is where the diagnosis actually happens. Each entry shows what is holding the leaking object in memory. The chain almost always points you directly at the fix:
- Chain ends in a Map or plain object at module scope → unbounded cache. Add LRU with size cap.
- Chain ends in an EventEmitter’s
_eventsarray → unremoved listener. Find the matching.off()orremoveListener()call. - Chain ends in a “context” entry → closure capturing a large object. Move the value outside the closure or null it after use.
- Chain ends in a Timer object → uncleared
setIntervalorsetTimeout. Store the handle and callclearInterval()on cleanup. - Chain ends in
globalor module scope directly → module-level array or object that grows unbounded. Add a max-length trim.
Find which code allocated the leak with the Allocation Profile
Snapshots tell you what is retained. They don’t tell you where it was created. Switch to the “Allocation instrumentation on timeline” profile in the same Memory tab, start recording, run your workload, stop. The flame graph that appears shows allocations grouped by call stack — including the file and line that allocated each retained chunk.
For headless / production captures, use --cpu-prof --heap-prof on the Node command line:
node --heap-prof --heap-prof-interval=512000 dist/server.js
# After running the workload, kill the process; it writes Heap.20240310.heapprofile
# Load that file in Chrome DevTools Performance tab.
This is especially useful for leaks that only manifest during a specific operation — say, only during file uploads, or only when a particular user action fires. Start the allocation timeline, perform the operation three or four times, stop. Bars that stay tall (allocations that were not freed) are the candidates. Click a tall bar to see the stack trace pointing at the exact line that allocated the retained object.
The –expose-gc flag: separating real leaks from delayed GC
Sometimes what looks like a leak is just V8 deferring garbage collection. The --expose-gc flag gives you a global.gc() function to force collection on demand. Use this in a test harness to prove a leak is real:
// Run with: node --expose-gc leak-test.js
async function testForLeak(workloadFn: () => void, iterations = 1000) {
  global.gc!();                                          // force GC before measuring
  const before = process.memoryUsage().heapUsed;

  for (let i = 0; i < iterations; i++) workloadFn();

  global.gc!();                                          // force GC after
  const after = process.memoryUsage().heapUsed;
  const deltaKB = (after - before) / 1024;

  console.log(`Heap delta after ${iterations} iterations: ${deltaKB.toFixed(0)} KB`);
  if (deltaKB > 1024) console.log('LEAK DETECTED — heap grew more than 1 MB');
}

// Example: test the suspect cache function
await testForLeak(() => getUser(Math.random().toString()));
A near-zero delta means no leak. Growing delta means the workload is retaining objects across calls. This is my go-to pattern before I ship a “fixed” memory leak to staging: the test proves the fix works under forced GC conditions, not just “it seemed fine for 30 minutes.”
Do not use global.gc() in production — it stalls the event loop for the duration of the collection.
The leaks I actually find in production
Eight years of paid debugging, sample of one — but the ranking holds across most Node.js apps I have audited:
| Pattern | How often | Fix shape |
|---|---|---|
| Unbounded Map / object cache | ~40% | LRU with size cap (lru-cache) |
| Event listener accumulation | ~20% | Move .on() outside request handler; use .once() |
| Closure over request object | ~15% | Extract values, drop the reference |
| Third-party library default config | ~10% | Read the docs, set the cap (Sentry breadcrumbs, OpenTelemetry buffers) |
| Promise chains that never resolve | ~5% | Add timeout; reject pending promises on shutdown |
| setInterval that closes over context | ~5% | Store handle, clearInterval when context dies |
| Native binding leaks (sharp, node-canvas) | ~3% | Update library; report upstream |
| Genuine V8 bug | ~2% | Update Node; report |
Pattern 1: the unbounded cache
The most common production leak. Looks innocent:
// LEAKS — userCache grows forever
const userCache = new Map<string, User>();

export async function getUser(id: string) {
  if (userCache.has(id)) return userCache.get(id)!;
  const user = await db.user.findUnique({ where: { id } });
  userCache.set(id, user!);
  return user!;
}
One million unique users over a week, one million entries in the Map, 400 MB of heap. Fix: bounded LRU.
import { LRUCache } from 'lru-cache';

const userCache = new LRUCache<string, User>({
  max: 5000,                          // hard upper bound
  ttl: 5 * 60 * 1000,                 // 5 minutes
});
The same pattern in 30 different shapes — request body cache, JWT verification cache, schema compilation cache, parsed user-agent cache. lru-cache with a max size and a TTL is the right answer for almost all of them.
For caches keyed by object references (not strings or numbers), WeakMap is a cleaner option — entries are automatically garbage-collected when the key object is no longer referenced elsewhere:
// WeakMap entry is freed automatically when 'requestObj' goes out of scope
const requestMetaCache = new WeakMap<Request, ParsedMeta>();

function getRequestMeta(req: Request): ParsedMeta {
  if (requestMetaCache.has(req)) return requestMetaCache.get(req)!;
  const meta = parseRequestMeta(req);
  requestMetaCache.set(req, meta);
  return meta;
}
WeakMap only works when the key is an object — you cannot use it for string or number keys. For string-keyed caches, lru-cache with an explicit max is the right tool.
Pattern 2: event listener accumulation
Looks like:
// LEAKS — every request adds a new listener
app.get('/notify', (req, res) => {
  eventBus.on('user-update', (user) => {
    res.write(`data: ${JSON.stringify(user)}nn`);
  });
  // res never closes; listener never removed
});
Node will warn at 10 listeners on the same emitter:
(node:1234) MaxListenersExceededWarning: Possible EventEmitter memory leak detected.
11 user-update listeners added to [EventEmitter]. Use emitter.setMaxListeners() to increase limit
Do not silence the warning. Fix the listener:
app.get('/notify', (req, res) => {
  const handler = (user: User) => res.write(`data: ${JSON.stringify(user)}nn`);
  eventBus.on('user-update', handler);
  req.on('close', () => eventBus.off('user-update', handler));
});
The pattern applies to any long-lived subscription: SSE endpoints, WebSocket handlers, anything that calls .on() inside a request handler. Always pair every .on() with a cleanup that fires when the request or connection closes.
Pattern 3: closure over request object
Looks innocent because the function is small:
// LEAKS — closure captures req, which holds the entire request body
const pending = new Map<string, () => void>();

app.post('/job', (req, res) => {
  const id = crypto.randomUUID();
  pending.set(id, () => {              // closes over req
    console.log(`done: ${req.body.user}`);
  });
  res.json({ id });
});
Each pending entry retains the callback, which retains req, which retains the request body. A request with a 5 MB JSON payload that hangs for an hour leaks 5 MB for the duration. Multiply by traffic; you have a problem.
// FIXED — extract the value, drop the request reference
app.post('/job', (req, res) => {
  const id = crypto.randomUUID();
  const userId = req.body.user;        // primitive, no retention
  pending.set(id, () => console.log(`done: ${userId}`));
  res.json({ id });
});
Pattern 4: third-party defaults
The Sentry leak from the opening was this. Sentry’s maxBreadcrumbs defaults to 100 per scope, which is fine — but if your code calls Sentry.addBreadcrumb() from inside a request and you don’t reset the scope per request, breadcrumbs from every request accumulate. Same shape with OpenTelemetry’s batch span processor (cap the queue), Pino transports (close them on shutdown), and a long tail of “telemetry library that retains data until you tell it not to.”
The fix is always the same: read the config docs, set explicit limits, never trust framework defaults for production.
Pattern 5: uncleared timers
A setInterval created inside a function without storing the handle is a leak with a delay:
// LEAKS — interval runs forever, closes over 'context'
function startMonitoring(context: JobContext) {
  setInterval(() => {
    context.checkStatus();             // closure keeps context alive
  }, 1000);
  // No way to stop this when the job completes
}

// FIXED — store the handle, clear on cleanup
function startMonitoring(context: JobContext) {
  const handle = setInterval(() => context.checkStatus(), 1000);
  context.on('done', () => clearInterval(handle));
  return handle;
}
In Node 20+, you can use AbortSignal with setInterval for cleaner cleanup:
const controller = new AbortController();
setInterval(() => context.checkStatus(), 1000, { signal: controller.signal });

// Stop the interval:
controller.abort();
clinic.js: the higher-level view
clinic.js wraps Node with a profiler that produces an HTML report you can read in your browser. Two commands relevant to memory work:
npm install -g clinic autocannon

# Heap profile + flame graph
clinic doctor -- node dist/server.js
# In another shell:
autocannon -c 50 -d 60 http://localhost:3000/suspect-endpoint
# Ctrl-C the clinic command. Browser opens with diagnosis.
clinic doctor diagnoses the shape of the problem (event loop blocked, memory growing, GC under pressure). For deeper memory work, clinic heapprofiler samples allocations and shows a flame graph of which functions allocated the most retained memory:
clinic heapprofiler -- node dist/server.jsThe flame graph shows code paths weighted by allocation. The widest stacks at the top are usually where your leak lives.
Production checklist
- Plot RSS in monitoring with a 24-hour-minimum window. Page on monotonic growth past a threshold.
- Verify with
heapUsed, not RSS, in Node 22+ — RSS growth alone can be V8’s page cache, not a leak. - Set
--max-old-space-sizeexplicitly in the Node command. Default 1.5 GB is rarely the right number for your droplet’s available RAM. - PM2’s
--max-memory-restartas a last-resort safety net, not a fix. Restarts are visible. - Bounded caches everywhere. If a Map can grow with traffic, it must have a max size and TTL.
- Use
WeakMapfor caches keyed by object references — entries free themselves automatically. - Listener cleanup on every long-lived response. SSE endpoints, WebSocket handlers, anything subscribing to event emitters.
- Capture heap snapshots regularly in staging under realistic load. Compare week-over-week to catch slow leaks before they ship.
- Sentry / OpenTelemetry / Pino: read the cap settings, set them explicitly, document the values.
- Regression tests for memory: run the leaky workload against the patched version, compare snapshot deltas. The
--expose-gc+global.gc()pattern is the fastest way. - Update Node and your runtime libraries. V8 leaks are rare but real; LTS upgrades fix them.
- Don’t run heap snapshots on a hot production process. They pause the event loop for 1–10 seconds. Take them on a single worker drained of traffic.
When not to chase the leak
- The process restarts cleanly every few hours and you do zero-downtime restart. If PM2 cluster mode rotates a worker every 6 hours and no user notices, the cost of finding the leak might exceed the cost of accepting it. (I will judge you, but the math sometimes wins.)
- The “leak” is a startup cost amortised over the process lifetime. Caches that fill in the first hour and stay flat are doing their job.
- Native bindings in third-party libraries. sharp, node-canvas, sometimes node-postgres binary — you can confirm the leak is there but you cannot fix it from JavaScript. Update the library, report upstream, accept restart-on-threshold as a workaround.
Troubleshooting FAQ
My RSS is high but the heap is small. What is leaking?
Native memory. JavaScript heap snapshots won’t show it. Inspect with node --report-on-fatalerror and look at the diagnostic report for “external” memory. Common culprits: Buffer.allocUnsafe usage, native modules (sharp, node-canvas, libuv I/O buffers).
Why does --max-old-space-size not match my droplet RAM?
Node’s default is 1.5 GB regardless of available RAM. On a 4 GB droplet you can safely set --max-old-space-size=3000 (3 GB) and leave headroom for the OS. Don’t set it to total RAM — your app will OOM-kill the kernel.
Should I use global.gc() in production?
No. global.gc() requires --expose-gc at startup, blocks the event loop for the duration of the GC, and is almost never the right tool. Use it only in tests to force collection between snapshots.
Heap snapshot crashed my process. What now?
Snapshots double peak memory briefly because V8 builds the graph in memory. Run them on a worker that has been drained from the load balancer. PM2 lets you target one worker by ID for the inspect port.
How do I attach Chrome DevTools to a Node process I already started?
kill -USR1 <pid> opens the inspector on a process that wasn’t started with --inspect. Then visit chrome://inspect on your laptop.
Does TypeScript prevent memory leaks?
No. TypeScript is a compile-time check; leaks are a runtime problem. The patterns above all happen in fully-typed code.
autocannon vs k6 for memory testing?
autocannon is simpler and node-native; k6 is more flexible with scripting (multi-step user journeys, JS test logic). For “hammer one endpoint and watch memory,” autocannon. For multi-step workflows that simulate users, k6.
Should I worry about memory in serverless functions?
Different problem. Serverless functions get their memory cap from the platform; leaks within a single invocation matter. Cross-invocation state (module-level Maps that persist across thaws) leaks more subtly. Treat the function as a process that lives for unknown duration; same patterns apply.
What is the three-snapshot technique and why use it over two snapshots?
Take baseline, run workload, take snapshot 2, run same workload again, take snapshot 3. Objects that grew from snapshot 1→2 and 1→3 by similar amounts are leaking (growth is proportional to traffic). Objects that grew in 1→2 but stabilised in 2→3 were warm-up allocations. Two snapshots can’t distinguish these — three can.
How do I prove the fix actually worked?
Run node --expose-gc leak-test.js with the test harness pattern above: force GC before and after 1,000 iterations of the fixed code. Near-zero heap delta confirms the fix. Then take heap snapshots in staging under the same load profile you used to diagnose the original leak and verify the delta is flat.
What ships next
This article covers diagnosis and the common patterns. Two adjacent topics worth their own posts: event-loop blocking diagnosis (different problem, similar tools) and proper graceful shutdown that drains in-flight requests before the process exits — half of “production crashes” turn out to be ungraceful exits, not leaks. If your leak is in a stream pipeline, the unbounded-buffer patterns in that article match the leak shapes here. If you are weighing frameworks, both Express and Fastify leak in the same shapes; the framework is rarely the cause.
Related memory and runtime work
- Node.js performance optimization for separating CPU, I/O, memory, and query bottlenecks.
- Node.js streams for avoiding large in-memory buffers.
- BullMQ background jobs for moving heavy work out of request paths.
- Dockerizing Node.js for memory limits and production process shape.