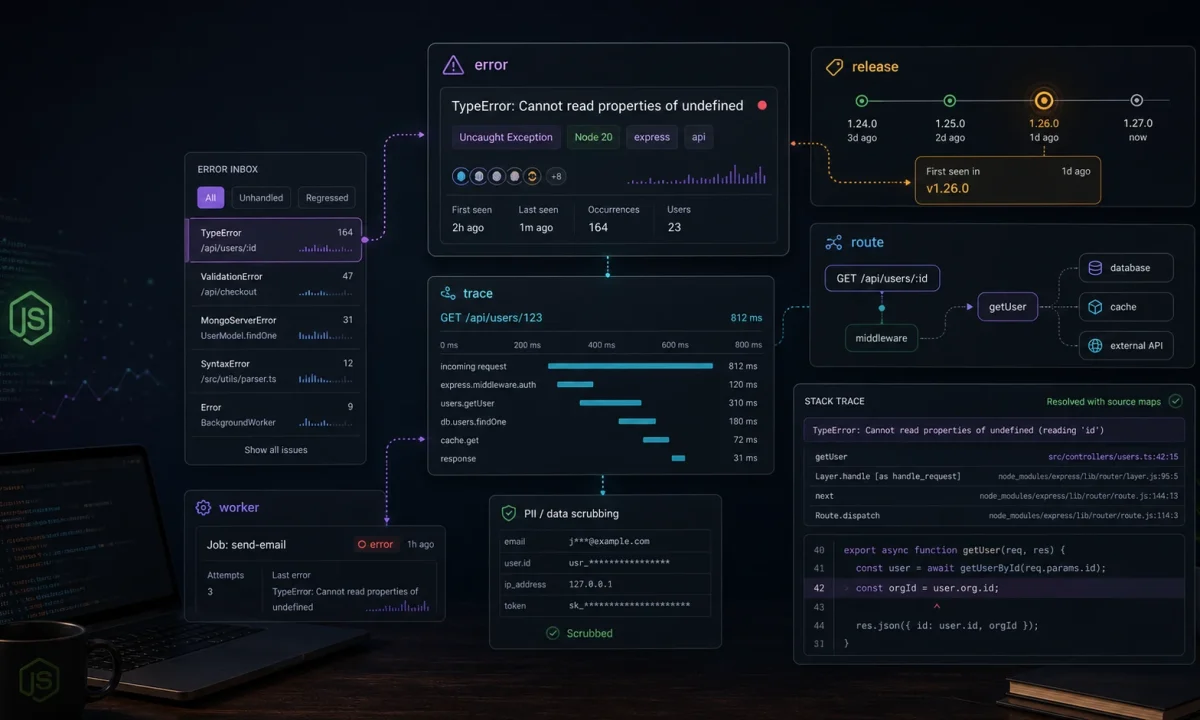
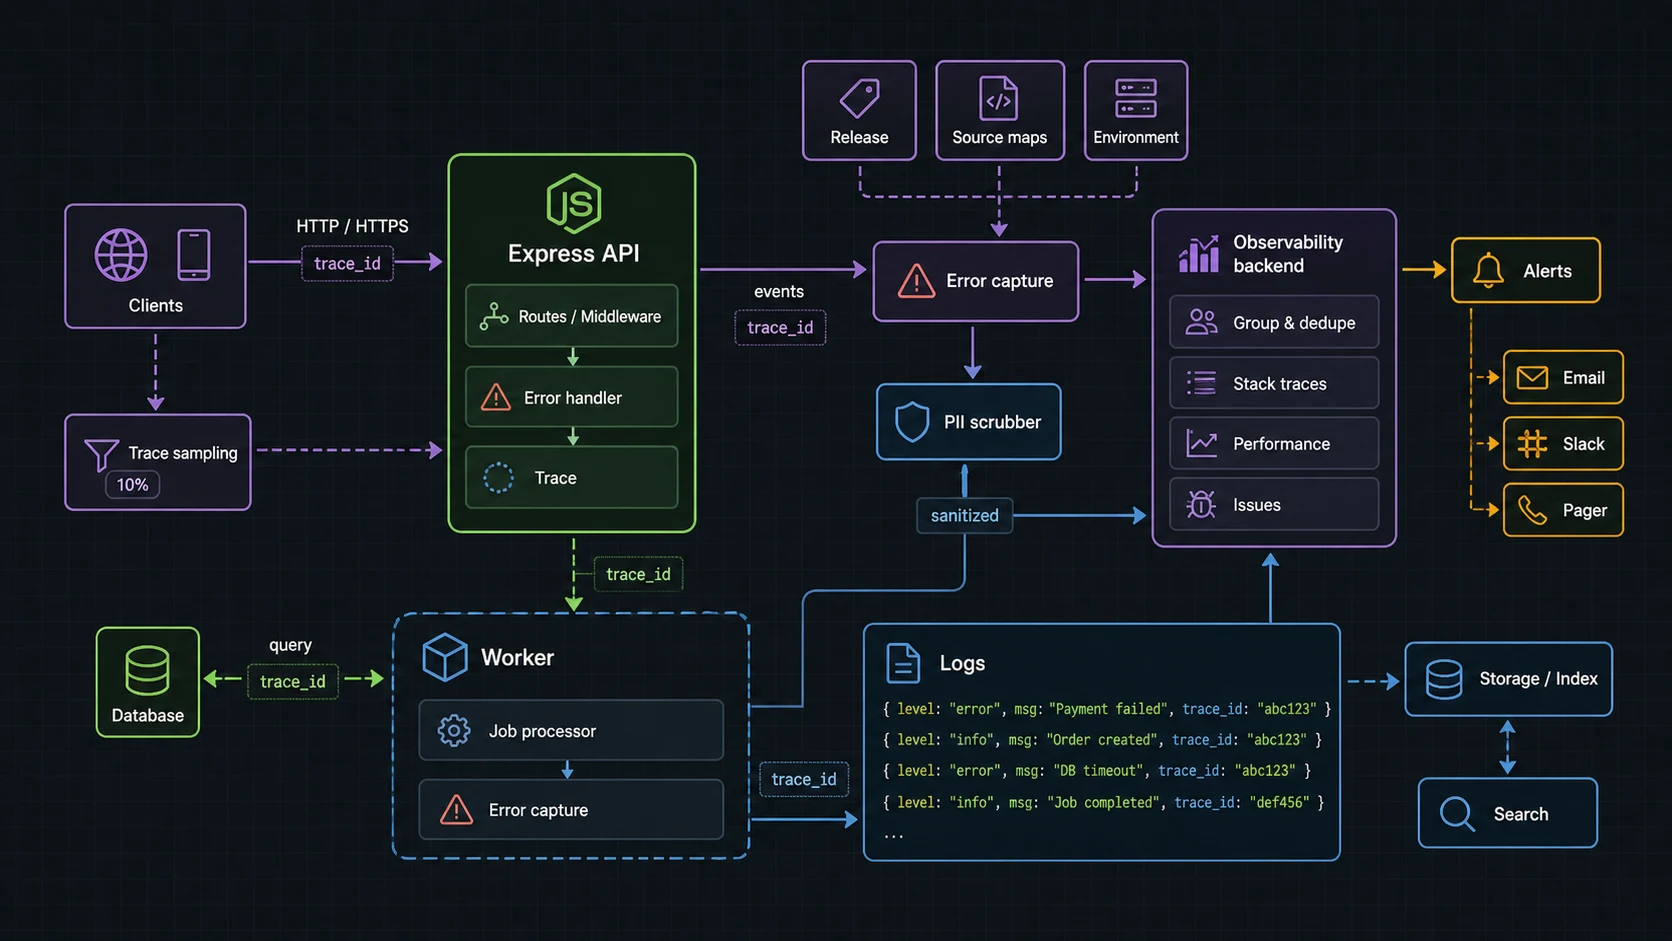
I do not care that an error tool can collect every exception. I care whether it tells me which deploy broke checkout, which customer hit it, which route got slow, and whether the same bug is already fixed on main. Sentry can do that for a Node.js API, but only if it is wired before the app has already lost the context.
This is my Sentry for Node.js APIs setup for Express services: initialize early, capture route errors, add traces where they help, scrub sensitive data, set releases, upload source maps, and keep alerts tuned enough that people still read them.
The install is not where Sentry projects go bad
npm install @sentry/nodeI test this setup on Node.js 24 LTS with the current Sentry JavaScript SDK line. Sentry has changed Express and sampling APIs across major versions, so pin @sentry/node in your lockfile and check the migration guide before upgrading.
The official Sentry Express docs are the source of truth for exact SDK wiring. The pattern below is intentionally close to those docs: initialize before the app does meaningful work, then attach Express error handling after routes.
Sentry has to initialize before Express hides the error
I put Sentry in its own module and import it from the server entry before route modules. That order matters because integrations patch and observe libraries as they load.
// src/observability/sentry.ts
import * as Sentry from "@sentry/node";

Sentry.init({
  dsn: process.env.SENTRY_DSN,
  environment: process.env.NODE_ENV ?? "development",
  release: process.env.SENTRY_RELEASE,
  tracesSampleRate: Number(process.env.SENTRY_TRACES_SAMPLE_RATE ?? 0.05),
  sendDefaultPii: false,
  beforeSend(event) {
    if (event.request?.headers) {
      delete event.request.headers.authorization;
      delete event.request.headers.cookie;
    }
    return event;
  },
});

export { Sentry };// src/server.ts
import "./observability/sentry";
import express from "express";
import { Sentry } from "./observability/sentry";
import { router } from "./router";
const app = express();
app.use(express.json({ limit: "1mb" }));
app.use(router);
Sentry.setupExpressErrorHandler(app);
app.use((err, req, res, _next) => {
console.error({ err, path: req.path }, "request failed");
res.status(err.statusCode ?? 500).json({
error: "Internal server error",
});
});
app.listen(process.env.PORT ?? 3000);If you initialize Sentry after importing half the app, you can still capture thrown errors, but you lose useful auto-instrumentation and context. That is the boring bug that makes production issues harder to read.
Capture expected errors differently
Not every 404 or validation failure belongs in Sentry. I send unexpected faults, not normal user mistakes.
app.post("/api/orders", async (req, res, next) => {
  try {
    const order = await createOrder(req.user.id, req.body);
    res.status(201).json(order);
  } catch (err) {
    if (err instanceof PaymentProviderTimeout) {
      Sentry.captureException(err, {
        tags: { area: "payments" },
        extra: { internalUserId: req.user.id },
      });
    }
    next(err);
  }
});
I tag domain areas like payments, auth, jobs, and uploads. Those tags become routing rules later. A single “backend error” inbox is where alert quality goes to die.
Tracing without lighting money on fire
Tracing is useful when it answers a question: which route is slow, which database call dominates, which upstream service is failing. I do not sample 100 percent of production traffic unless the service is tiny and the bill is irrelevant.
Sentry.init({
  dsn: process.env.SENTRY_DSN,
  tracesSampler(samplingContext) {
    const name = samplingContext.name ?? "";

    if (name.includes("/health")) return 0;
    if (name.includes("/billing")) return 0.25;
    if (process.env.NODE_ENV !== "production") return 1;

    return samplingContext.inheritOrSampleWith(0.05);
  },
});
If you need broader distributed traces across services, pair this with an OpenTelemetry rollout. Sentry is excellent at error triage. OpenTelemetry is the wider telemetry plumbing when many services are involved.
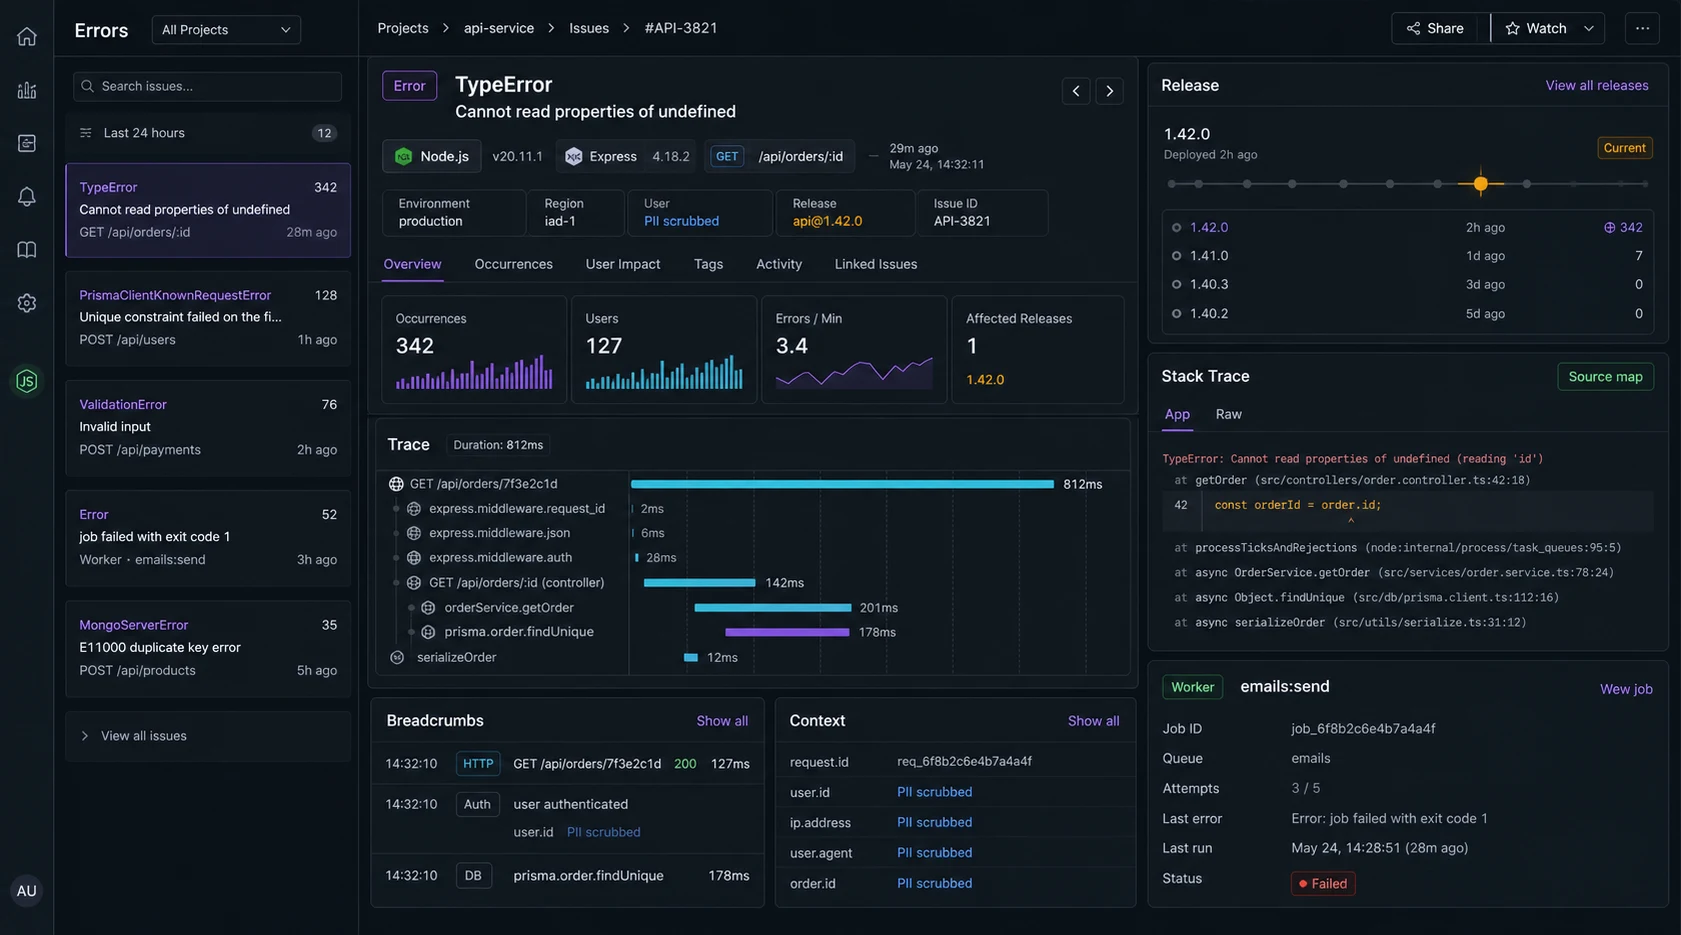
Source maps are useless when releases do not match
Minified or compiled stack traces waste time. Every production deploy should set a release name and upload source maps for the built artifact. The release should match your deploy SHA or build ID.
export SENTRY_RELEASE="$(git rev-parse --short HEAD)"
npm run build
npx sentry-cli sourcemaps upload ./dist --release "$SENTRY_RELEASE"
Then run Node with the same release value:
SENTRY_RELEASE="$(git rev-parse --short HEAD)" node dist/server.jsThis is the difference between “TypeError in dist/chunk.js line 1” and a stack trace you can actually fix. The same deploy discipline belongs in CI; the GitHub Actions pipeline covers that side.
Error context becomes a privacy bug if you let it
Node APIs carry secrets: authorization headers, cookies, email addresses, payment IDs, session tokens, request bodies. I start with sendDefaultPii: false and add only the context needed to debug. When I attach a user identifier, it is an internal ID, not an email address or raw personal profile.
- Strip
authorization,cookie, API keys, and session headers. - Do not send full request bodies for login, payment, health, or upload routes.
- Use internal user IDs, not raw personal data, when possible.
- Set retention and access rules inside Sentry for production projects.
The Node.js API security checklist is the broader pass. Sentry should help incident response without becoming a second sensitive-data store.
Worker errors do not pass through Express
Express error handlers do not catch failures in workers. For BullMQ or cron jobs, initialize Sentry in the worker entry and capture job context explicitly.
worker.on("failed", (job, err) => {
  Sentry.captureException(err, {
    tags: { area: "worker", queue: job.queueName },
    extra: {
      jobId: job.id,
      attemptsMade: job.attemptsMade,
      name: job.name,
    },
  });
});
Do not attach full job payloads by default. Upload imports, webhooks, and billing jobs often contain data you do not want copied into an error tool.
Alert rules that stay useful
- Page humans on new high-volume errors in production, not every first occurrence.
- Route billing/auth errors differently from admin-panel annoyances.
- Ignore health checks, bot noise, and known client disconnects.
- Group by route, error class, and release when possible.
- Review the top noisy issues once a week and delete rules that nobody trusts.
Sentry vs OpenTelemetry: how I split the job
The official Sentry Express docs are the right source for current middleware setup. I still keep the mental model separate from OpenTelemetry: Sentry is where I want grouped errors, releases, stack traces, and triage. OTel is where I want portable traces across a fleet.
| Need | Tool I reach for first | Reason |
|---|---|---|
| Which deploy introduced this exception? | Sentry | Release-aware error grouping |
| Why did this request take 8 seconds? | Sentry trace or OpenTelemetry trace | Depends on service count and backend |
| How do requests move across five services? | OpenTelemetry | Vendor-neutral distributed tracing |
| Which log line belongs to this error? | Sentry + structured logs | Use trace IDs and request IDs |
Release hygiene breaks when CI and deploy disagree
Source maps only help if the release value in Sentry matches the artifact running in production. I set the release from the git SHA in CI, upload maps after build, then deploy that exact artifact. The GitHub Actions pipeline is the pattern I use for that handoff.
env:
  SENTRY_RELEASE: ${{ github.sha }}

steps:
  - run: npm ci
  - run: npm run build
  - run: npx sentry-cli sourcemaps upload ./dist --release "$SENTRY_RELEASE"
  - run: docker build --build-arg SENTRY_RELEASE="$SENTRY_RELEASE" .
I also keep the API security checklist nearby when wiring Sentry. Error tools are useful precisely because they collect context; that same context can become a privacy problem if nobody reviews it.
Signal quality: the difference between useful Sentry and noisy Sentry
Sentry gets ignored when it becomes a bucket of expected 404s, validation errors, bot traffic, and duplicate worker failures. I set the rules early: operational errors get captured with context, expected user mistakes are handled without alerting, and noisy routes get sampled before the team learns to mute the project.
- Initialize Sentry before Express routes and before worker processors start.
- Attach release, environment, route, request ID, and user/account ID only when policy allows it.
- Scrub tokens, cookies, authorization headers, payment payloads, and uploaded file names.
- Separate alerts for checkout, auth, queue workers, and generic API errors.
- Review ignored errors every month; stale ignore rules hide real regressions.
The Sentry Express docs cover setup, but the editorial choice is alert design. I would rather have five issues the team trusts than five hundred events nobody opens. For cross-service latency, pair this with an OpenTelemetry rollout; for application logs, keep the Pino logging setup tied to the same request ID.
FAQ
Where should I initialize Sentry in a Node.js app?
In the server entry, before importing routes and most app modules. Early initialization gives Sentry the best chance to attach integrations and context.
Where does the Express Sentry error handler go?
After routes and before your final custom error response middleware.
Should I enable Sentry tracing in production?
Yes, but sample it. Start low, raise sampling on important routes, and exclude health checks.
Does Sentry replace logs?
No. Use structured logs for the full event stream and Sentry for grouped exceptions, traces, releases, and alerting. The Pino vs Winston guide covers the logging side.
Can Sentry capture worker errors?
Yes, but workers need their own initialization and explicit capture around failed jobs, cron tasks, and queue handlers.
When Sentry is the wrong first move
The winning Sentry setup is not loud. It is early, sparse, tagged, scrubbed, and tied to releases. When production breaks, I want a short path from alert to route to deploy to stack trace. Everything else is dashboard decoration.
I would not start with Sentry if the app has no release process, no owner for alerts, and no rule for what data can leave the system. You will collect noise faster than you collect answers. Fix logging and deployment hygiene first, then let Sentry point at real production changes.