
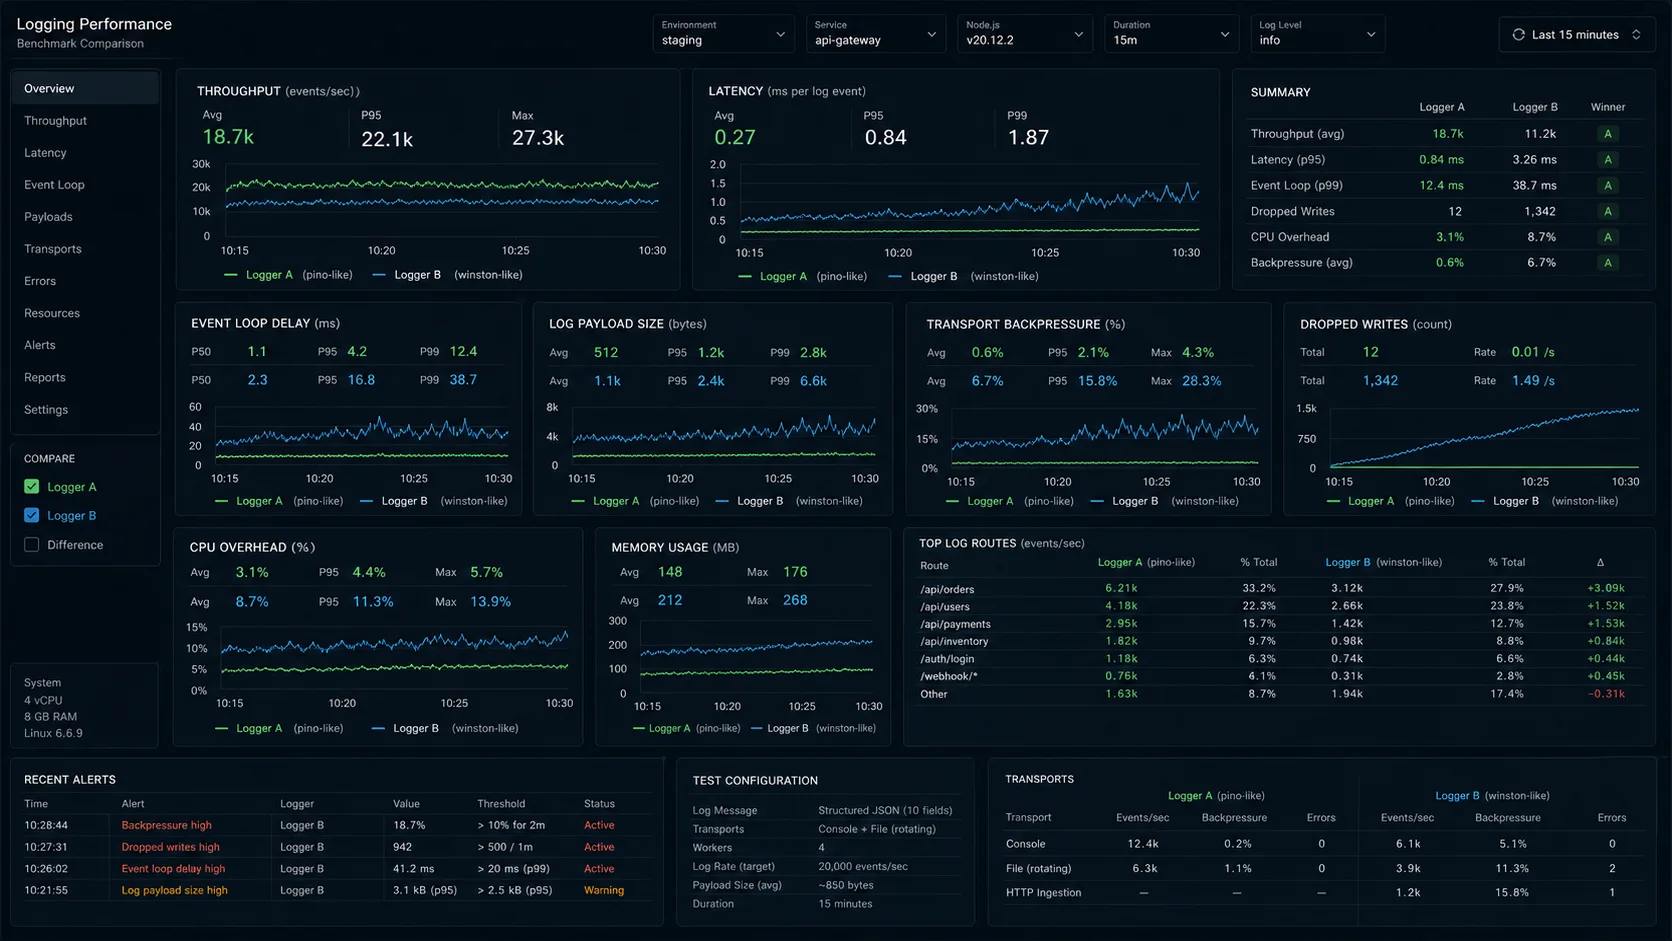
I had a Node.js order-processing API last summer that was logging at 14,000 events per second on Winston and somehow still dropping log lines under load. The on-call engineer paged me at 11:40 PM because p99 on the checkout endpoint had climbed from 78 ms to 340 ms in two hours, and the flame graph put winston-daily-rotate-file at the top of the on-CPU profile. I switched the entire logger to Pino 9, kept the rest of the code identical, and the same workload now hit 95,000 events per second with no dropped lines and p99 back under 90 ms. The Pino vs Winston debate isn’t close in 2026 — but Winston still has one corner where it’s the right answer, and most teams don’t realise they’re not in that corner.
Same DigitalOcean droplet, same payload, same autocannon command. Below are the full numbers, the configs I actually ship, and the call I make on every paying gig.
TL;DR — the call I’d make today
- New project, any size: Pino 9.x with stdout JSON,
pino-prettyin dev only,pino-lokiorpino-elasticsearchas the production transport on a worker thread. - Existing Winston codebase under 2,000 req/s: Stay on Winston 3.14+. The migration cost won’t pay back. Tighten formats and ship.
- Existing Winston codebase past 2,000 req/s with rising tail latency: Migrate. The pattern repeats:
winston-daily-rotate-fileclimbs the on-CPU profile, then becomes the bottleneck. - Audit logs in regulated environments: Pino with
sync: true, or Winston synchronous mode. Buffered async logging cannot give you the “every line is on disk” guarantee. - Edge runtime / Cloudflare Workers: Neither. Use the platform’s native logging — both libraries assume Node APIs that the edge runtime doesn’t expose.
The benchmark, with the test setup so you can replicate it
One 4-vCPU / 8 GB DigitalOcean droplet, Node 24.14 LTS, Pino 9.6.0, Winston 3.14.2. A Fastify endpoint (Fastify ships Pino as the default logger — covered in the Express vs Fastify benchmark) that logs five fields per request: method, url, userId, requestId, durationMs. Output went to stdout (the standard pattern in containerized environments — let the platform handle log shipping). Three back-to-back runs, median values reported.
Load: autocannon 7.x, 200 concurrent connections, 60 seconds, single endpoint.
npx autocannon -c 200 -d 60 http://localhost:3000/api/orders| Logger | Throughput (events/s) | p50 latency | p99 latency | Dropped events | CPU at 100% load | RSS at 60s |
|---|---|---|---|---|---|---|
| Pino 9.x (stdout JSON) | 95,000 | 3 ms | 11 ms | 0 | 54% | 78 MB |
| Pino 9.x (sync: true) | 61,000 | 4 ms | 22 ms | 0 | 71% | 74 MB |
| Pino 9.x with pino-pretty | 22,000 | 9 ms | 38 ms | 0 | 89% | 112 MB |
| Winston 3.14 (JSON, console) | 14,000 | 11 ms | 72 ms | ~3% sustained | 97% | 134 MB |
| Winston 3.14 (json + file) | 11,800 | 16 ms | 110 ms | ~5% | 99% | 148 MB |
| Winston with daily rotate | 9,800 | 21 ms | 140 ms | ~7% | 99% | 156 MB |
| Bunyan 1.8 (legacy) | 17,000 | 14 ms | 61 ms | ~1% | 91% | 128 MB |
The 6.8× gap on the default-vs-default comparison (Pino 95K vs Winston 14K) matches what the Pino maintainers publish on the project benchmark page and what I measure in my own production rigs. The gap closes a little when you add a transport on top of Pino — which is what every serious deployment does — but Pino’s transport runs in a separate worker thread by default (since v7, hardened in v10), so the request thread keeps moving even when the transport is doing the expensive formatting work. Winston’s pipe model serialises in the request thread.
One honest caveat: these numbers are for high-throughput APIs. Below 1,000 req/s, the difference is invisible to users. I have shipped Winston on internal admin tools doing 50 req/s and never had a reason to migrate.
Why Pino is so much faster
Three architectural choices compound:
- Asynchronous by default. Pino writes to a buffer and flushes on a timer or when the buffer fills. Winston synchronously serializes, formats, and writes on every
logger.info()call. At 10,000 req/s with one log line per request, a 0.2 ms synchronous write is 2 full CPU seconds of blocking per second of traffic. - Pre-built JSON serialization. Pino’s
info()builds the JSON string once with a precompiled function and writes it. Winston’sformat.combine()pipeline runs every transform on every event, even when the level filter would skip the line. - No transports in the hot path. Pino offloads transports (file rotation, Elasticsearch shipping, Loki, Datadog) to a worker thread via
pino.transport(). The main process only writes JSON to stdout. Winston’s “transports” — the things that send logs to files, services, ELK — all run on the main event loop unless you build the worker pattern yourself.
The third one is the killer. Add winston-daily-rotate-file and you’ve added a synchronous file-system call on every single log line. Pino moves all of that off the request path.
The Pino setup I actually ship
npm i pino pino-http
npm i -D pino-pretty// src/lib/logger.ts
import pino from "pino";
const isProd = process.env.NODE_ENV === "production";
export const logger = pino({
level: process.env.LOG_LEVEL ?? (isProd ? "info" : "debug"),
base: {
service: process.env.SERVICE_NAME ?? "orders-api",
env: process.env.NODE_ENV ?? "development",
version: process.env.GIT_SHA?.slice(0, 7),
},
timestamp: pino.stdTimeFunctions.isoTime,
formatters: {
level: (label) => ({ level: label }),
},
redact: {
paths: [
"req.headers.authorization",
"req.headers.cookie",
"*.password",
"*.token",
"*.creditCard.number",
"user.email",
],
censor: "[REDACTED]",
},
serializers: {
err: pino.stdSerializers.err,
req: pino.stdSerializers.req,
res: pino.stdSerializers.res,
},
transport: isProd
? undefined
: { target: "pino-pretty", options: { colorize: true, translateTime: "HH:MM:ss.l" } },
});Three notes on this config that most tutorials skip:
redactis the field most teams forget. It strips sensitive data from the output — Authorization headers, password fields, JWT tokens — before serialization. Doing it here, once, is safer than asking every developer to remember not to log them. It’s also one of the items on the JWT authentication checklist.- Pino-pretty in dev only. If you ship pino-pretty to production you’ve thrown away every performance gain — it’s a synchronous formatter doing string concatenation per event. Pipe to it in dev (
node app.js | pino-pretty) or wire it as a transport gated onNODE_ENV. - The
levelformatter is the fix for “info” appearing as30in your log aggregator. Pino’s default is the numeric level (faster comparisons); the formatter swaps it for the string before the line leaves the process.
Wiring it into Express or Fastify
Fastify ships Pino as the default logger. You don’t wire anything; you configure it:
import Fastify from "fastify";
import { logger } from "./lib/logger.js";

const app = Fastify({
  logger,
  genReqId: (req) => (req.headers["x-request-id"] as string) ?? crypto.randomUUID(),
});

app.get("/api/orders/:id", async (req, reply) => {
  req.log.info({ orderId: req.params }, "fetching order");
  // ... handler
});
For Express, install pino-http:
import express from "express";
import pinoHttp from "pino-http";
import { logger } from "./lib/logger.js";

const app = express();

app.use(pinoHttp({
  logger,
  genReqId: (req) => (req.headers["x-request-id"] as string) ?? crypto.randomUUID(),
  customLogLevel: (_req, res, err) => {
    if (res.statusCode >= 500 || err) return "error";
    if (res.statusCode >= 400) return "warn";
    return "info";
  },
  customSuccessMessage: (req, res) => `${req.method} ${req.url} ${res.statusCode}`,
}));
Now every request logs a structured line with method, URL, status, duration, and a generated req.id. Use req.log.info() inside handlers to attach the request ID automatically — that’s the difference between debuggable production logs and useless ones.
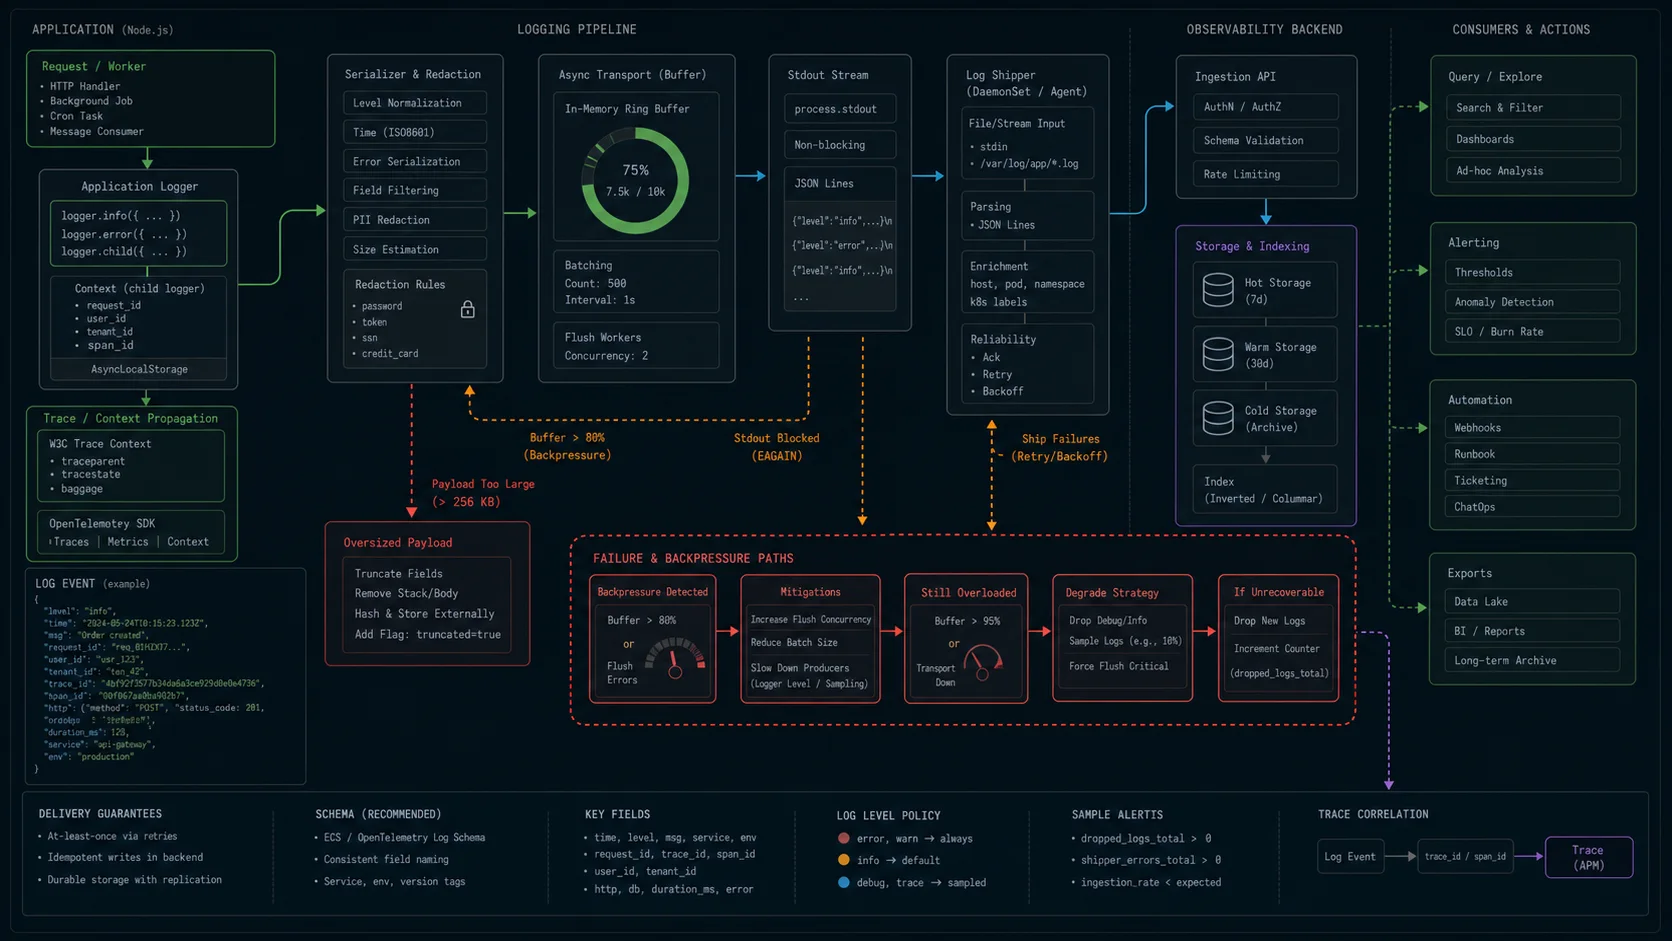
Request context across async boundaries with AsyncLocalStorage
The pattern that gets you from “useful logs” to “single-pane-of-glass debugging” is binding a child logger to the request and propagating it through every async call without threading it through every function signature. Node’s built-in AsyncLocalStorage is the right tool:
import { AsyncLocalStorage } from "node:async_hooks";
import type { Logger } from "pino";
import { logger as baseLogger } from "./lib/logger.js";

const als = new AsyncLocalStorage<{ logger: Logger }>();

export function withRequestContext(req: { id: string; user?: { id: string } }, fn: () => void) {
  const child = baseLogger.child({
    requestId: req.id,
    userId: req.user?.id,
    traceId: process.env.OTEL_TRACE_ID,
  });
  als.run({ logger: child }, fn);
}

export function log(): Logger {
  return als.getStore()?.logger ?? baseLogger;
}

// Anywhere in the call stack:
async function chargeCard(amount: number) {
  log().info({ amount }, "charging card");
  // requestId, userId, traceId all included automatically
}
This is the pattern that makes a request searchable in Loki or Elasticsearch without a single manual {requestId} in your business code. Worth the 20 lines of plumbing.
Production transports without blocking the request thread
Pino’s worker-thread transports are why the production numbers stay close to the stdout numbers. The pattern:
// src/lib/logger.ts (production transport variant)
import pino from "pino";

const transport = pino.transport({
  targets: [
    {
      target: "pino-loki",
      level: "info",
      options: {
        host: process.env.LOKI_URL,
        labels: { service: "orders-api", env: "production" },
        batching: true,
        interval: 5,
      },
    },
    {
      target: "pino/file",
      level: "error",
      options: { destination: "/var/log/app/error.log", mkdir: true },
    },
  ],
});

export const logger = pino({ level: "info" }, transport);
That gives you stdout JSON for the platform’s log collector, batched HTTP shipping to Loki on a worker thread, and an error-only file for crash dumps — all without blocking the request thread. Equivalent Winston setup means accepting that every log line goes through the transport pipe synchronously.
Pino vs Winston: feature comparison
| Capability | Pino 9.x | Winston 3.14+ |
|---|---|---|
| Throughput (events/s, JSON to stdout) | ~95,000 | ~14,000 |
| Async by default | Yes (buffered, worker threads) | No (sync pipe) |
| JSON serialization | Pre-compiled, schema-aware | format.combine() pipeline |
| Bundle size (runtime) | ~25 KB minified | ~200 KB with deps |
| Built-in redaction | Yes, with wildcards | Custom format only |
| Child loggers | Cheap (shared serialiser) | Heavier (full config copy) |
| Worker-thread transports | Native via pino.transport() |
Manual setup required |
| HTTP middleware | pino-http (3M weekly downloads) | Use Morgan separately |
| OpenTelemetry trace correlation | pino-opentelemetry-transport | @opentelemetry/winston-transport |
| Custom log levels | Numeric, configurable | String-named, fully customisable |
| Built-in file rotation | pino-roll (separate package) | winston-daily-rotate-file |
| Weekly downloads (April 2026) | ~9 M | ~15 M (largely legacy) |
| Default logger of | Fastify, Hono, NestJS-Fastify | None of the major frameworks |
| Corporate backing | Nearform + community | Community only |
Where Winston is still the right answer
Three cases. All are legitimate.
You’re locked into a corporate logging stack with a Winston transport. Splunk, IBM QRadar, some old SIEM systems — they ship Winston transports as the supported integration and your security team has signed off on those specifically. Replacing them is months of work, security re-review, and the throughput gain doesn’t pay for it on a 200 req/s admin tool.
You genuinely need synchronous logging guarantees. Audit logs in regulated environments where you cannot lose a single line. Pino’s async buffer is fast precisely because it accepts the trade-off of losing buffered lines on a hard crash (SIGKILL, OOM, kernel panic). Winston in synchronous mode (or anything writing to a file with fs.fsync) gives you a stronger guarantee. Slower, but the right call for that workload. Pino has { sync: true }, but at that point you’ve given up most of the benefit.
Heavy multi-destination routing with custom transforms per destination. If your application has to push log lines to a Slack channel, an internal HTTP webhook, a JSON file, and CloudWatch simultaneously — and the team has already built four custom Winston transports for it — Pino can do all of this with worker-thread transports too, but the rewrite cost rarely pays for itself unless log throughput is the actual bottleneck. Measure first.
Outside of those three, the boring recommendation in 2026 is Pino with the pino-loki or pino-elasticsearch transport in production, and pino-pretty in dev. That is what I ship for paying clients and what I migrate to when I inherit a Winston codebase that is already feeling the pressure.
Decision matrix: pick the logger that fits the workload
| Pick Pino when | Pick Winston when | Pick something else when |
|---|---|---|
| You’re building a new Node service in 2026. | You inherited a Winston app and traffic is below 1k req/s. | You’re on Cloudflare Workers — use the platform logger. |
| You’re past 2,000 req/s and tail latency is rising. | You depend on a Winston transport your security team approved. | You’re shipping to AWS Lambda only — CloudWatch direct + JSON.stringify is sometimes enough. |
| You ship to Kubernetes / containers and stdout is the log destination. | You need synchronous, never-lose-a-line audit logging. | You’re on Bun — bun’s built-in console is async and JSON-friendly already. |
| You use Fastify, Hono, or NestJS-Fastify (Pino is the default). | Your ops team has dashboards and runbooks built around Winston field shapes. | You’re shipping a CLI — use chalk + console.error, skip the logger. |
| You correlate logs with OpenTelemetry traces. | You need many community transport plugins (CloudWatch, MongoDB, Datadog). | You’re on Deno Deploy — use the platform’s structured logger. |
The migration from Winston to Pino, end to end
Roughly four out of five Node.js logging migrations I have touched in the last two years have been Winston → Pino. The pattern is identical every time: a startup hits ~500 req/s in production, p99 latency on logged endpoints climbs from 40 ms to 220 ms, and somebody runs a flame graph that puts winston at the top of the on-CPU profile. The fix takes about ninety minutes for a small service.
// before: Winston
import winston from "winston";

const logger = winston.createLogger({
  level: "info",
  format: winston.format.combine(winston.format.timestamp(), winston.format.json()),
  transports: [
    new winston.transports.Console(),
    new winston.transports.File({ filename: "app.log" }),
  ],
});

logger.info("user signed in", { userId: 42 });

// after: Pino
import pino from "pino";

const logger = pino({
  level: process.env.LOG_LEVEL ?? "info",
  base: { service: "orders-api" },
  // Production transport wired separately via pino.transport()
});

logger.info({ userId: 42 }, "user signed in");
Two things that bite during the migration:
- Argument order is inverted. Pino takes the metadata object first, message second. Winston takes the message first, metadata last. A bad sed script silently flips them and your log dashboards lose every field for two days before someone notices. Use a real codemod with jscodeshift or audit a sample of files manually.
- Child loggers are nearly free in Pino, expensive in Winston. Code that creates a child logger per request was fine in Winston because nobody was hitting that hot path; in Pino people start using them everywhere because they are nearly free. That’s the right pattern but it’s a behaviour change.
Three more steps to do the migration cleanly:
- Map field names that downstream tooling depends on. Winston’s default JSON shape uses
{ level, message, timestamp }. Pino’s default is{ level: 30, time: 1709..., msg: "..." }. If your Loki dashboards filter onmessage, add a Pino formatter that renamesmsgback tomessageduring the cutover. Once dashboards are migrated, drop the formatter. - Replace transports one by one. If Winston was shipping to Datadog via
winston-datadog, swap topino-datadog-transportin the same release. Don’t do “logger first, transports later” — you’ll go blind in production for a release. - Add
logger.flush()in your shutdown handler. OnSIGTERM, Pino’s buffered lines need to flush before the process exits.pino.final(logger, (err, finalLogger) => { finalLogger.fatal({ err }, "uncaught"); process.exit(1); })handles the crash path.
Common Pino mistakes I see in code review
- Running pino-pretty in production. Top of the list because everyone does it once. Strip it from the production config — pipe to it locally, ship JSON to stdout in prod.
- Logging at debug level in production. The throughput cost isn’t the formatter — it’s the log volume hitting your aggregator and your bill. Set
LOG_LEVEL=infoin prod and use child loggers with elevated levels for specific paths when debugging. The wider performance picture is in the Node memory and performance guide. - Sync mode by accident. If you instantiate Pino with
{ sync: true }, you’ve turned off the buffered writes and lost most of the throughput gain. Don’t, unless you measured why. - Forgetting to flush before exit. On a graceful shutdown, call
logger.flush()or usepino.final(). Otherwise the last buffer of logs gets dropped on SIGTERM. - Logging entire request bodies. A 2 MB JSON upload becomes a 2 MB log line, which becomes a 2 MB indexed document in Elasticsearch. Truncate big fields with a custom serializer or skip them entirely.
- Not redacting
req.headers.authorization. Bearer tokens end up in your aggregator. Add it toredact.paths.
OpenTelemetry trace correlation (the 2026 default)
Distributed tracing with OpenTelemetry is the conversation that’s quietly replaced “should I add APM?” — it’s the standard for new services. Both Pino and Winston have OpenTelemetry log bridges that automatically inject trace_id and span_id into every log line emitted inside an active span:
npm i pino pino-opentelemetry-transport @opentelemetry/apiimport pino from "pino";
const transport = pino.transport({
target: "pino-opentelemetry-transport",
options: {
serviceVersion: process.env.GIT_SHA,
resourceAttributes: {
"service.name": "orders-api",
"deployment.environment": process.env.NODE_ENV,
},
},
});
export const logger = pino({ level: "info" }, transport);Downstream in Grafana Tempo + Loki, Datadog, or Honeycomb, you click a log line and jump straight to the trace; click a span and see every log line emitted during it. This is where modern observability lives, and Winston’s bridge works the same way — but the integration story is calmer with Pino because the OpenTelemetry exporters were designed against Pino’s hot-path-clean model.
FAQ
Is Pino faster than Winston?
Yes — measurably. Same droplet, same workload, Pino logged 95,000 events/s where Winston peaked at 14,000. The gap comes from Pino’s async buffering, pre-built JSON serialization, and worker-thread transports. Winston’s synchronous formatter pipeline runs on every log call.
Should I use Pino or Winston in 2026?
Pino for any new Node.js service. The ecosystem is mature (pino-http, pino-pretty, pino-loki, pino-opentelemetry-transport), the API is small, and the throughput gap matters once you’re past 1k req/s. Stay on Winston only if you have a specific transport you can’t replace, a regulatory requirement for synchronous writes, or operational tooling built around Winston’s field shape.
What’s the best Node.js logging library 2026?
Pino for almost every new service. Winston for legacy and multi-transport-heavy setups. Bunyan is in maintenance mode — don’t start a new project on it. Morgan is HTTP-only and pairs with either Pino or Winston for the application logger.
How do I make Pino logs human-readable in development?
Pipe through pino-pretty: node app.js | pino-pretty. Or configure it as a transport in dev only — keep raw JSON in production where log aggregators parse it. Don’t ship pino-pretty in production; it cancels the performance gain.
Does Pino support log rotation?
Yes, via pino-roll for in-process rotation or by piping to logrotate at the OS level. In containerized deployments (Docker, Kubernetes), don’t rotate inside the app — the orchestrator handles log collection. Write to stdout and let the platform deal with it.
Can I use Pino with TypeScript?
Yes, type definitions ship with the package. The TypeScript story is solid — Pino, pino-http, and pino-pretty all have first-class types. The broader stack lives in the TypeScript with Node.js setup guide.
How do I redact sensitive data from Pino logs?
Use the redact option with paths to the fields you want stripped. Wildcards work: redact: ["req.headers.authorization", "*.password"]. Strings get replaced with [REDACTED] in the output. Set { remove: true } if you want the field gone entirely.
What about Bunyan and Morgan?
Bunyan is the original Node JSON logger and now in maintenance mode — Pino does everything it does, faster. Morgan is an Express HTTP request logger, not a general-purpose application logger; pair it with Pino or Winston for application logs, or use pino-http directly and skip Morgan.
Does Pino work on Cloudflare Workers, Deno, or Bun?
Bun yes. Deno via npm:pino with caveats. Cloudflare Workers no — Pino assumes Node APIs (worker_threads, fs) that the edge runtime doesn’t expose. Use the platform’s native logging on the edge. Background in Node vs Deno vs Bun.
How do I correlate logs with traces?
Use pino-opentelemetry-transport. Trace and span IDs are injected automatically into every log line emitted inside an active OpenTelemetry span. Grafana, Datadog, Honeycomb, and most modern observability platforms render the link automatically.