The worst Node.js incident I debugged last year had clean logs and useless logs. Every service logged its own request ID. None of the IDs crossed service boundaries. The API gateway said the request took 7.8 seconds. The orders service said 140 ms. Payments said nothing because the timeout happened before its handler logged. We spent 47 minutes guessing.
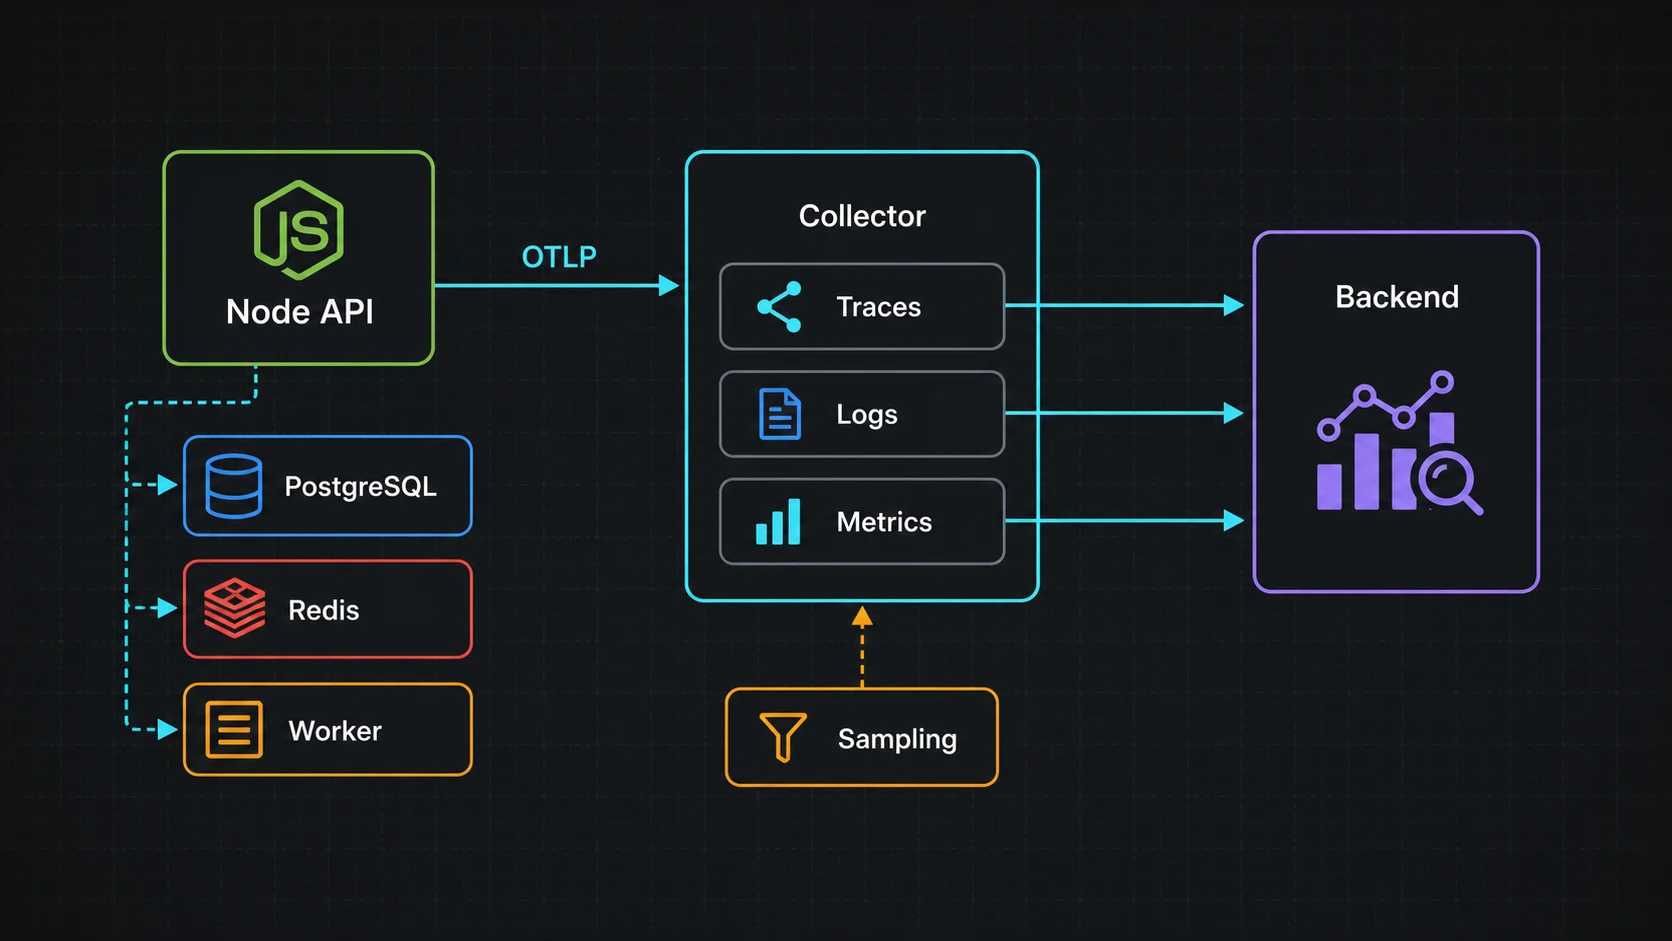
OpenTelemetry in Node.js fixes that class of incident when you wire it before you need it. Not by making dashboards pretty. By giving one request a trace ID that survives HTTP calls, Postgres queries, Redis locks, queue handlers, and downstream timeouts. This is the setup I ship now: one bootstrap file imported first, auto-instrumentation for the boring spans, manual spans only around business operations, OTLP export, sane sampling, and trace IDs in logs.
The install that should not touch route code
The official OpenTelemetry JavaScript docs are the source of truth. For a Node.js API, the moving parts are the SDK, resource metadata, auto-instrumentations, and an exporter.
npm i
  @opentelemetry/api
  @opentelemetry/sdk-node
  @opentelemetry/auto-instrumentations-node
  @opentelemetry/exporter-trace-otlp-http
  @opentelemetry/resources
  @opentelemetry/semantic-conventions
I test this shape on Node.js 24 LTS with current OpenTelemetry JavaScript packages and the OpenTelemetry Collector v0.151.x line. Pin exact package and Collector versions in your lockfile or deployment manifest, then upgrade deliberately.
The bootstrap file that has to load before the app
This file must run before your server imports instrumented libraries. If Express, Fastify, pg, Redis, or the HTTP client loads first, you will lose spans and then wonder why the trace is half empty. For ESM services that rely on auto-instrumentation, follow the OpenTelemetry loader/zero-code docs as well; import order alone is not enough when the module loader has already evaluated dependencies.
// src/otel.ts
import { NodeSDK } from "@opentelemetry/sdk-node";
import { getNodeAutoInstrumentations } from "@opentelemetry/auto-instrumentations-node";
import { OTLPTraceExporter } from "@opentelemetry/exporter-trace-otlp-http";
import { resourceFromAttributes } from "@opentelemetry/resources";
import { ATTR_SERVICE_NAME, ATTR_SERVICE_VERSION } from "@opentelemetry/semantic-conventions";

const serviceName = process.env.OTEL_SERVICE_NAME ?? process.env.SERVICE_NAME ?? "node-api";
const serviceVersion = process.env.GIT_SHA ?? "dev";

const sdk = new NodeSDK({
  resource: resourceFromAttributes({
    [ATTR_SERVICE_NAME]: serviceName,
    [ATTR_SERVICE_VERSION]: serviceVersion,
    "deployment.environment.name": process.env.NODE_ENV ?? "development",
  }),
  traceExporter: new OTLPTraceExporter({
    url: process.env.OTEL_EXPORTER_OTLP_TRACES_ENDPOINT ?? "http://localhost:4318/v1/traces",
  }),
  instrumentations: [
    getNodeAutoInstrumentations({
      "@opentelemetry/instrumentation-fs": { enabled: false },
    }),
  ],
});

await sdk.start();

process.on("SIGTERM", async () => {
  await sdk.shutdown();
});
Then import it first:
// src/server.ts
import "./otel.js";
import Fastify from "fastify";

const app = Fastify({ logger: true });
app.get("/healthz", async () => ({ ok: true }));
await app.listen({ port: 3000, host: "0.0.0.0" });
That import order is the difference between useful tracing and a dashboard that claims every request only touched your router.
The local Collector test that catches bad exporters
I do not point every app directly at a vendor during local development. I run the OpenTelemetry Collector and send data to whatever backend I am testing.
# otel-collector.yml
receivers:
  otlp:
    protocols:
      http:
      grpc:

exporters:
  debug:
    verbosity: basic

service:
  pipelines:
    traces:
      receivers: [otlp]
exporters: [debug]# docker-compose.yml
services:
otel-collector:
image: otel/opentelemetry-collector:0.151.0
command: ["--config=/etc/otel-collector.yml"]
volumes:
- ./otel-collector.yml:/etc/otel-collector.yml
ports:
- "4318:4318"
- "4317:4317"Once the collector shows spans, swap the exporter to Honeycomb, Grafana Tempo, Datadog, New Relic, or whatever your team already pays for. The app should not care.
Logs are useless when the trace ID disappears
Traces are for shape. Logs are for details. The bridge is the trace ID.
import { trace } from "@opentelemetry/api";
import pino from "pino";

export const logger = pino({
  mixin() {
    const span = trace.getActiveSpan();
    const ctx = span?.spanContext();
    if (!ctx) return {};
    return {
      trace_id: ctx.traceId,
      span_id: ctx.spanId,
    };
  },
});
With that, I can click a slow trace, copy the trace ID, and pull every log line for the same request. The Pino vs Winston benchmark covers why I use Pino here: low overhead and JSON output that log pipelines can parse without theatre.
Manual spans: only where the business begins
Auto-instrumentation will give you HTTP and database spans. Manual spans should describe the thing the business cares about: charging a card, reserving inventory, generating a report, refreshing a cache.
import { trace, SpanStatusCode } from "@opentelemetry/api";

const tracer = trace.getTracer("orders-service");

export async function placeOrder(input: PlaceOrderInput) {
  return tracer.startActiveSpan("orders.place", async (span) => {
    try {
      span.setAttribute("customer.id", input.customerId);
      span.setAttribute("order.item_count", input.items.length);

      const order = await createOrder(input);
      await reserveInventory(order);
      await chargePayment(order);

      span.setAttribute("order.id", order.id);
      return order;
    } catch (err) {
      span.recordException(err as Error);
      span.setStatus({ code: SpanStatusCode.ERROR });
      throw err;
    } finally {
      span.end();
    }
  });
}
Do not attach email addresses, JWTs, raw request bodies, or payment details as span attributes. Trace data spreads into vendor tools and long-lived storage. Treat it as production data.
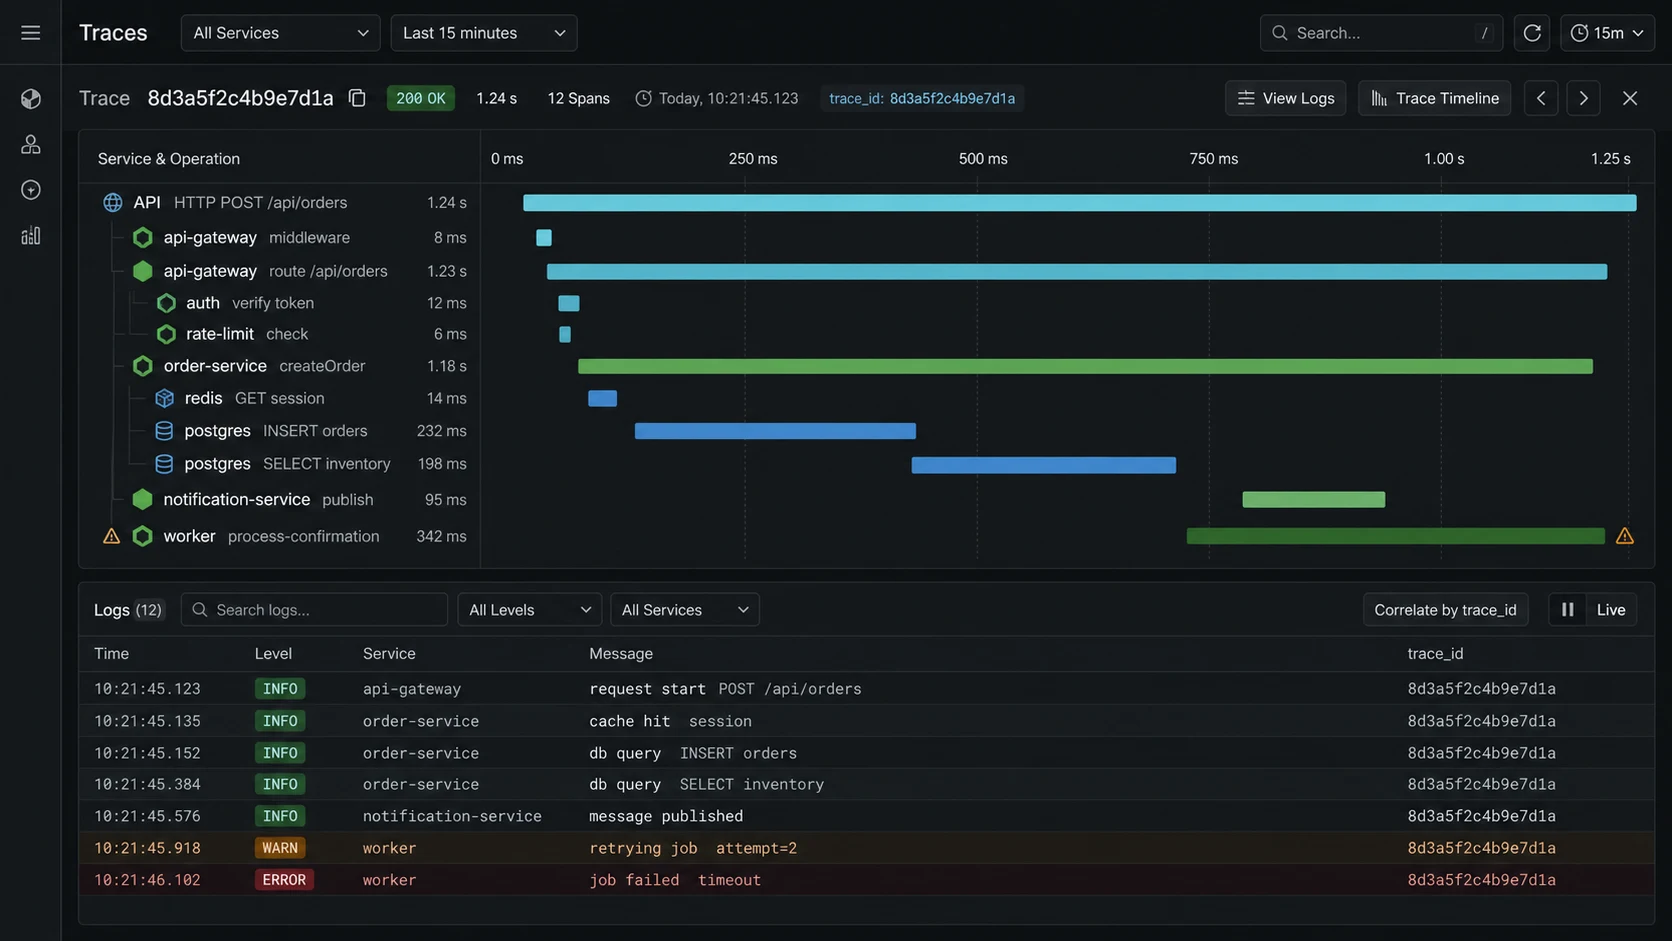
What a useful incident trace shows
A trace that helps at 3 a.m. answers four questions fast:
- Which service owned the slowest span?
- Was the time spent in code, Postgres, Redis, HTTP, or a queue?
- Did the downstream service receive the same trace context?
- Did retries, locks, or rate limits multiply the latency?
If a trace only says GET /orders/:id 7800ms, it is not enough. I want to see orders.find, SELECT orders, redis.lock.acquire, GET payments/internal/status, and the exact span that blew the budget.
Sampling without lying to yourself
At low traffic, sample every request. At higher traffic, keep all errors and a percentage of healthy requests. Head sampling is simple but can miss slow requests that become interesting after the decision. Tail sampling in the collector is better when the team is mature enough to run it.
| Traffic | Sampling I start with | Why |
|---|---|---|
| Small API | 100% | Cheap, easiest during early debugging |
| Busy API | 10-25% + all errors | Enough shape without huge bills |
| Incident window | Temporarily raise | Short burst of detail beats guessing |
| High-scale system | Tail sampling | Keep slow/error traces after seeing the full trace |
Sampling is a cost control, not an excuse to fly blind. If you cannot reconstruct a real outage from traces and logs, the sampling strategy is wrong.
The bugs that make OpenTelemetry look broken
- Import order wrong. Instrumentation loads after Express or pg, so spans are missing.
- No service name. Every span shows up as
unknown_service. - Trace context dropped. Custom HTTP clients or queues do not pass
traceparent. - Too many manual spans. Every helper function becomes noise.
- Secrets in attributes. Someone adds request bodies to traces and creates a data-retention problem.
- Exporter on the hot path. Bad config makes telemetry slow down the app. Use batching and the collector.
The checklist I run before trusting traces
otel.tsimported first in the app entry point.- Service name, version, and environment set as resource attributes.
- OTLP export to a collector, not hard-coded vendor logic in app code.
- Trace IDs included in structured logs.
- Manual spans only around business operations.
- PII and secrets banned from span attributes.
- Errors recorded on spans, not swallowed by generic middleware.
- Sampling policy written down and tested during an incident drill.
Exporter choice: do not couple the app to one vendor
The official OpenTelemetry JavaScript docs describe OTel as the API and SDK layer for traces, metrics, and logs. In production I keep the application speaking OTLP and let the Collector or hosting layer decide where telemetry goes. That keeps the Node service portable between Honeycomb, Grafana Tempo, Datadog, New Relic, Sentry, or an internal collector.
| Exporter path | When I use it | Risk |
|---|---|---|
| App -> OTLP HTTP/gRPC -> Collector | Most production services | One extra moving part, but clean routing |
| App -> vendor SDK/exporter | Small app with one observability vendor | Harder migration later |
| Zero-code auto instrumentation | Fast rollout or legacy service | Less explicit control over naming and sampling |
The zero-code JavaScript instrumentation docs are useful when I need coverage quickly. For a service I own long term, I still add a small bootstrap file because I want explicit service names, resource attributes, sampling, and log correlation.
Semantic names beat clever names
Bad trace names make good tooling feel broken. I keep route names stable and low-cardinality: GET /orders/:id, not GET /orders/ord_123. User IDs, order IDs, and email addresses belong in carefully chosen attributes or logs, not in span names.
- Use
service.name,deployment.environment.name, and release/SHA attributes on every service. - Keep span names stable enough to aggregate.
- Attach business attributes sparingly: plan tier, queue name, provider name, not raw payloads.
- Push noisy IDs into structured logs and correlate with
trace_id.
This is where traces and logs meet. If the app uses Pino, the Pino vs Winston guide covers the logging choice; this article covers the trace ID you want inside those logs.
What I check after rollout
After enabling OTel, I do not declare victory because spans appear. I check whether the data answers incident questions:
- Can I find a failed request by trace ID from a log line?
- Can I see database, Redis, HTTP client, and queue timing in one trace?
- Can I separate deploy versions and environments?
- Are health checks and static assets sampled out?
- Do p95/p99 route spans match the application latency dashboard?
If the answer is no, I fix the instrumentation before adding more dashboards. More telemetry with bad names is just a bigger bill.
The Collector failure mode I test
Tracing should help debug an outage, not become the outage. When the app exports through an OpenTelemetry Collector, I test what happens when the Collector is slow, unavailable, or rejecting data. The app should keep serving traffic, drop or batch telemetry within a bounded queue, and make the loss visible in logs or metrics.
- Keep OTLP exporter timeouts short enough that a dead collector cannot stall request handling.
- Use batch span processing, not one synchronous export per request.
- Give the Collector its own health check and deployment budget.
- Record telemetry-drop counters where the team will actually see them.
- Keep service names and route names stable so sampling still produces useful aggregates.
The Collector docs are the operational side of this setup, and the semantic conventions are the guardrail against high-cardinality trace chaos. I treat both as part of the application, because bad telemetry design becomes production debt just like a bad database schema.
FAQ
Does OpenTelemetry slow down Node.js?
It can if you over-instrument or export badly. With auto-instrumentation, batching, and a collector, overhead is usually acceptable for APIs. Measure p95 before and after.
Should I use OpenTelemetry or my vendor SDK?
Use OpenTelemetry for instrumentation and let the collector export to the vendor. It keeps the app portable.
Do I need manual spans?
Yes, but only for business operations. Auto-instrumentation cannot know that three SQL queries and one Redis lock mean “place order.”
How do traces connect across microservices?
Through W3C trace context headers, especially traceparent. The HTTP instrumentation propagates it for normal clients; custom queues and message brokers may need manual propagation.
Where should I start?
One API, one collector, one trace backend, one slow endpoint. Prove it helps there before rolling it across every service.
When OpenTelemetry is the wrong first move
Tracing is one leg of observability. The other two are metrics and logs. Pair this with the logging benchmark, the performance checklist, and the microservices guide if a request crosses service boundaries.
I would not start with OpenTelemetry on a tiny single-service API that already has clean structured logs and one obvious bottleneck. Add request IDs, slow query logging, and a basic error tool first. OTel earns its keep when the request crosses process boundaries or when nobody can explain where the time went.