I once watched a perfectly boring Node.js API fall over at 9:06 a.m. because every pod had its own tiny connection pool and nobody had done the multiplication. Eight pods, 20 connections each, two background workers, one migration job that somebody ran from CI, and a managed Postgres instance capped at 120 connections. The error looked harmless: remaining connection slots are reserved for non-replication superuser connections. The outage was not harmless. Checkout stalled for 11 minutes.
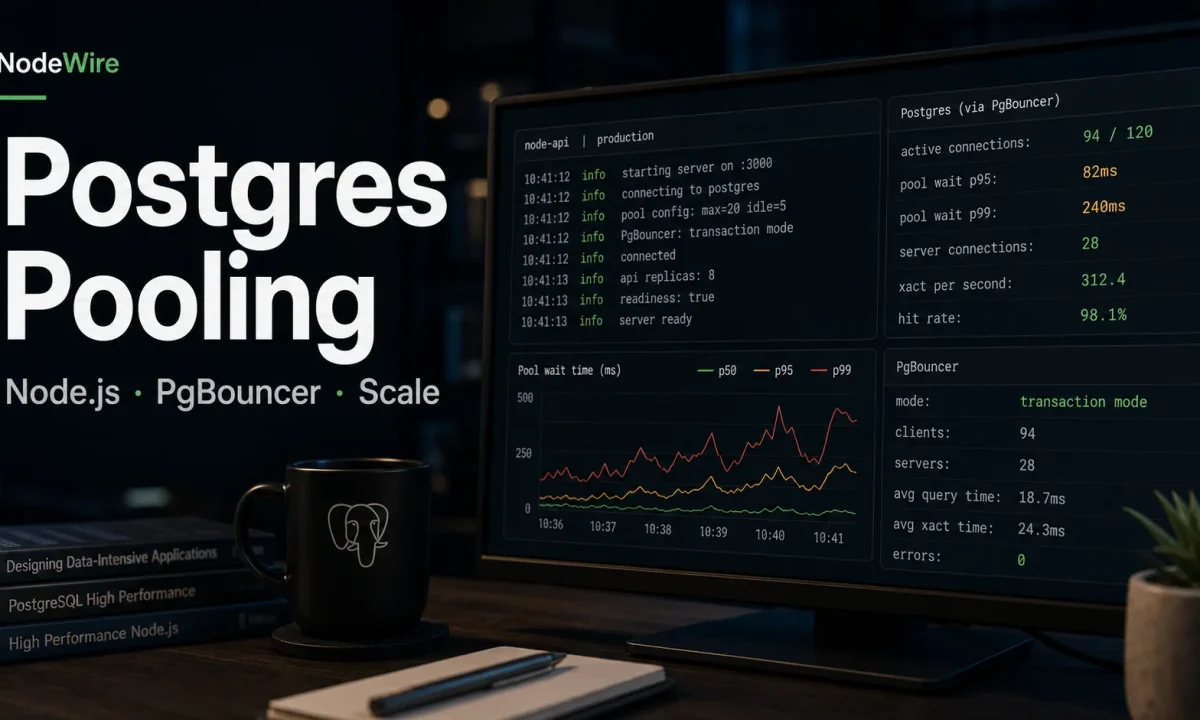
PostgreSQL connection pooling in Node.js is one of those topics that feels solved until traffic, autoscaling, or serverless enters the room. The code below is the setup I use now: small app-side pools, clear timeouts, PgBouncer when the process count grows, Prisma connection limits when Prisma is in the stack, and a dashboard that catches connection leaks before users do.
The connection math that bites
The mistake is treating pool size as a per-app setting. It is not. It is a per-process multiplier.
total_possible_connections =
  app_replicas
  * node_processes_per_replica
  * pool_max
  + background_workers
  + migration_jobs
  + admin_sessions
If you run four Kubernetes replicas, PM2 cluster with two workers each, and max: 15, your API can open 120 database connections before a queue worker, Prisma Studio, or a migration touches the database. That is how small APIs accidentally exhaust Postgres.
My default ceiling is boring: reserve 20 percent of Postgres connections for admin, migrations, and surprise jobs. Then divide the rest across all app processes. If the math gives me a pool larger than 10, I usually ask whether the API needs fewer replicas, better queries, or PgBouncer. A bigger pool is rarely the first fix.
The node-postgres pool I ship first
The official node-postgres pooling docs are right about the shape: create one pool per process and reuse it. Do not create a pool inside a request handler. Do not call new Pool() per tenant unless you enjoy debugging slow leaks.
import pg from "pg";

export const pool = new pg.Pool({
  connectionString: process.env.DATABASE_URL,
  max: Number(process.env.PG_POOL_MAX ?? 10),
  min: 0,
  connectionTimeoutMillis: 2_000,
  idleTimeoutMillis: 30_000,
  maxLifetimeSeconds: 60 * 30,
  application_name: process.env.SERVICE_NAME ?? "nodewire-api",
});

pool.on("error", (err) => {
  console.error({ err }, "unexpected idle Postgres client error");
});

export async function query<T = unknown>(text: string, values: unknown[] = []) {
  const start = performance.now();
  const result = await pool.query(text, values);
  const ms = Math.round(performance.now() - start);
  if (ms > 500) console.warn({ ms, text }, "slow Postgres query");
  return result as pg.QueryResult<T>;
}
Three settings matter more than people think:
connectionTimeoutMillisstops requests hanging forever when the pool cannot get a client.idleTimeoutMilliscloses quiet clients instead of keeping a stale pile of connections around.maxLifetimeSecondsrotates clients so load balancers, failovers, and old sockets do not stay alive for days.
The leak pattern: forgetting release()
If you use pool.connect(), you own the client until you release it. Missing finally is the classic slow leak.
const client = await pool.connect();
try {
  await client.query("BEGIN");
  await client.query("UPDATE accounts SET balance = balance - $1 WHERE id = $2", [amount, from]);
  await client.query("UPDATE accounts SET balance = balance + $1 WHERE id = $2", [amount, to]);
  await client.query("COMMIT");
} catch (err) {
  await client.query("ROLLBACK");
  throw err;
} finally {
  client.release();
}
Most simple queries should use pool.query() because it checks out and releases automatically. Reach for pool.connect() only for transactions, session state, cursors, or advisory locks.
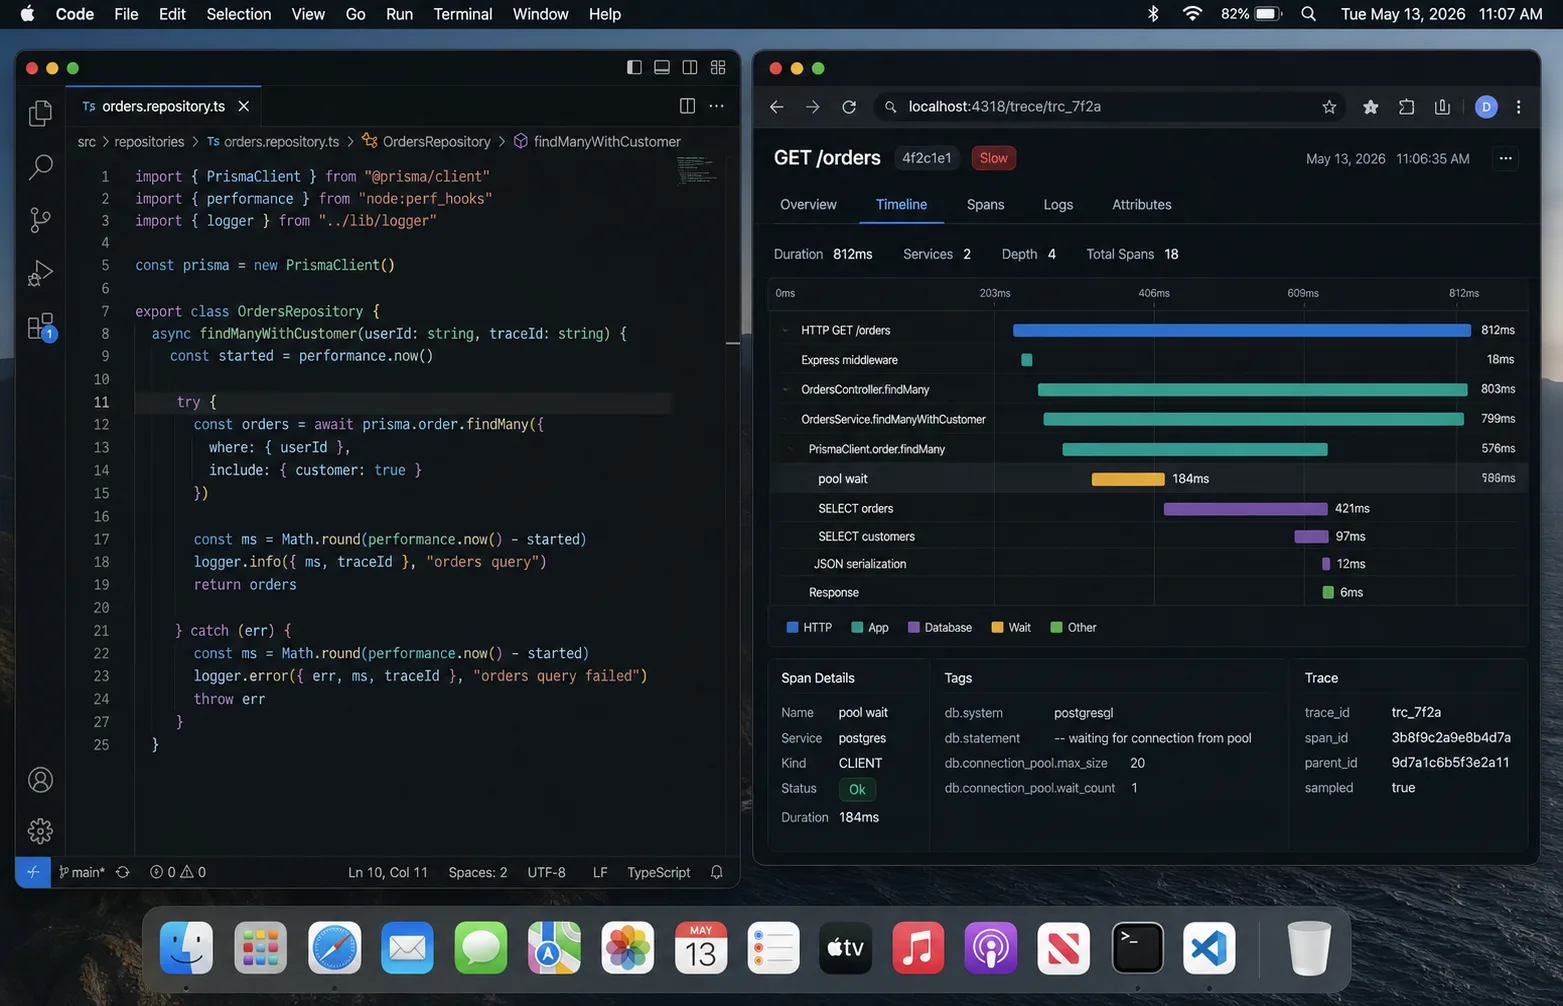
Prisma changes the pool math
Prisma brings its own query engine and connection pool. The Prisma connection pool docs are worth reading before you scale replicas, because the pool is per Prisma Client instance. One client per process is fine. A new Prisma Client per request is a connection storm.
DATABASE_URL="postgresql://app:secret@db:5432/app?connection_limit=5&pool_timeout=10"That connection_limit=5 looks tiny until you multiply it by eight pods. I usually run Prisma APIs at 5-10 connections per process and only raise it after the metrics show pool wait time, not just slow queries.
When PgBouncer earns its keep
PgBouncer is not magic. It is a connection broker that lets many app clients share fewer Postgres server connections. The official PgBouncer config docs split the world into three pool modes:
| Mode | Use it when | Watch out for |
|---|---|---|
| Session | Your app needs session state, prepared statements, temp tables | Lowest pooling benefit |
| Transaction | Most web APIs; each transaction can use any server connection | Session features break or surprise you |
| Statement | Very narrow read-heavy workloads | Multi-statement transactions do not work |
Transaction pooling is the default I try for raw pg APIs. With Prisma, prepared statements and transaction behaviour need more care. If the ORM docs say to use a specific mode or disable prepared statements, believe them and test the built artifact, not just the happy path.
Serverless is a different problem
A long-running API opens a handful of connections and keeps them warm. A serverless function can create hundreds of short-lived processes in a spike. That is where app-side pooling stops helping. The process dies before the pool becomes useful, and Postgres sees a stampede.
For serverless Node.js + Postgres, I want one of these in front:
- managed connection pooling from the database provider;
- PgBouncer in transaction mode;
- a serverless-aware database driver or HTTP proxy if the provider supplies one;
- lower concurrency at the platform level if the workload can queue.
The wrong fix is increasing max_connections until Postgres spends memory on idle sessions and still falls over during the next deploy.
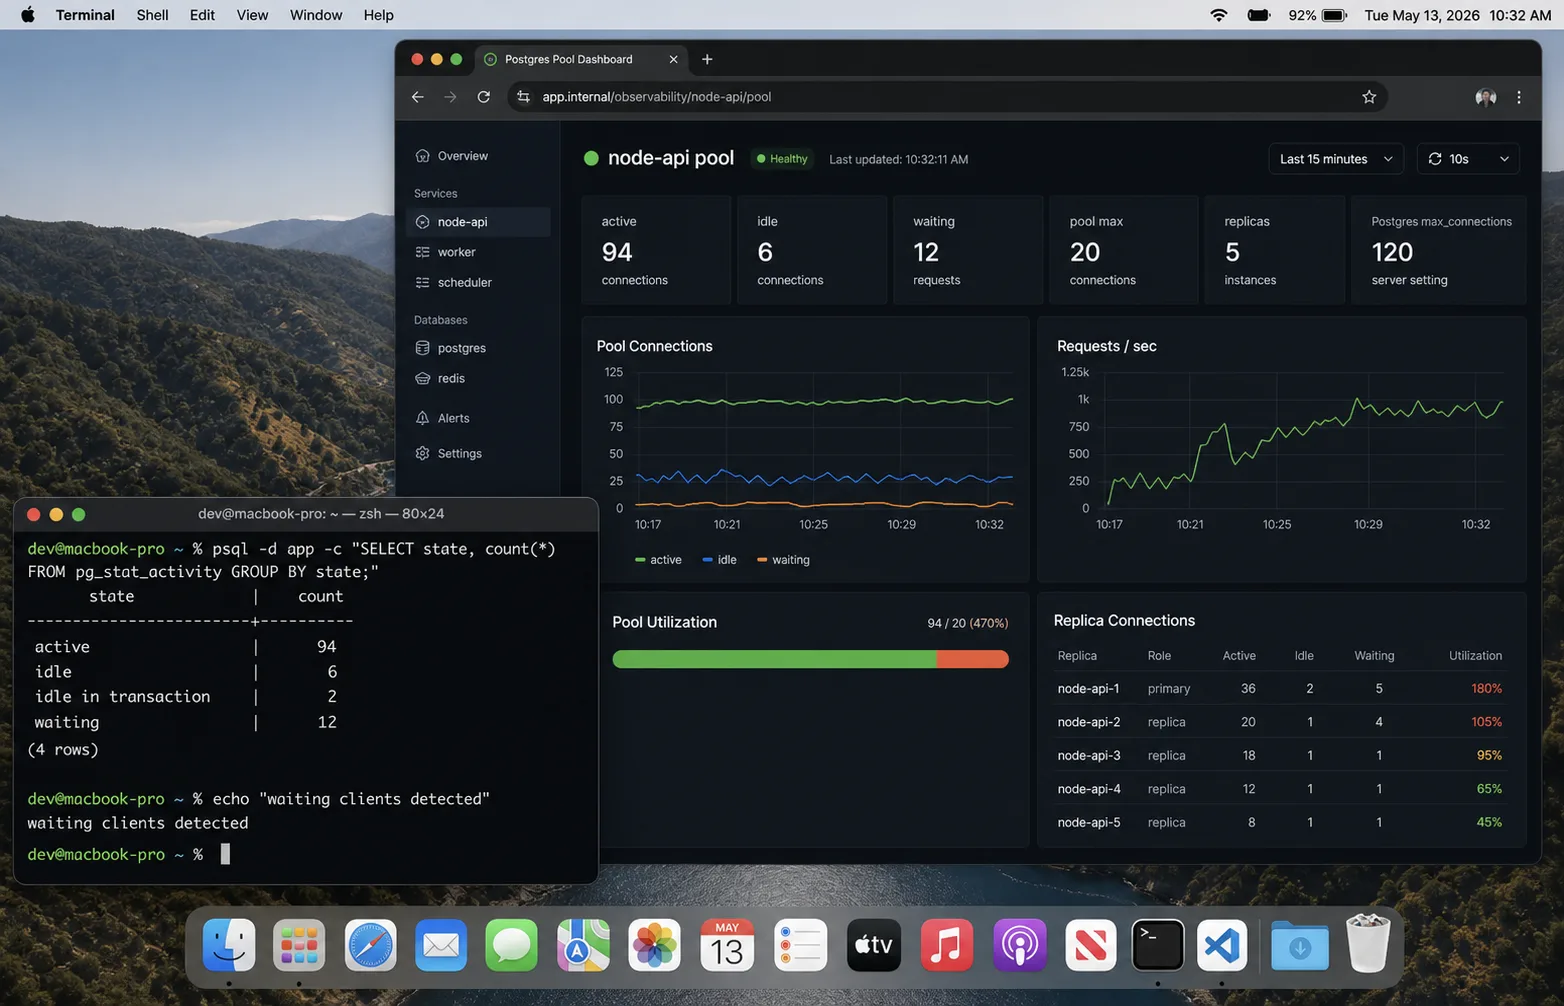
The dashboard I check first
Connection bugs are visible before they become outages if you graph the right things:
- Postgres active vs idle connections from
pg_stat_activity. - Pool wait time in the Node process. If requests wait for a client, the app pool is saturated.
- Query p95/p99 latency, split by route or operation name.
- Connection errors:
too many clients, timeouts, reset sockets. - Replica/process count next to connection count. Autoscaling should explain jumps.
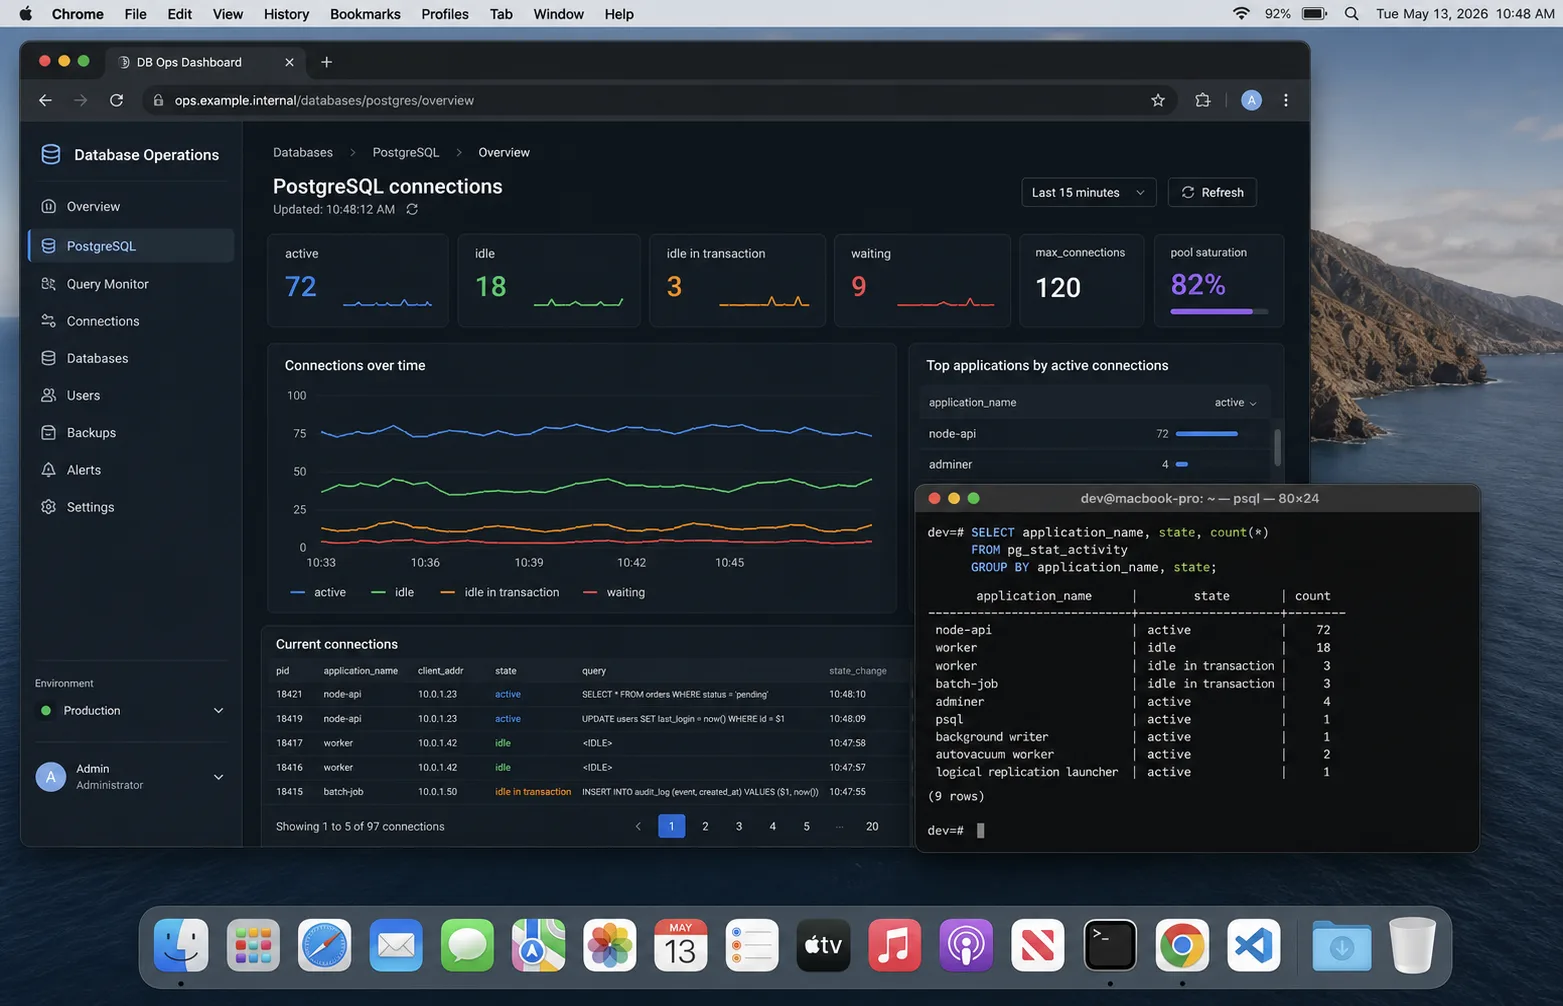
select
  application_name,
  state,
  count(*)
from pg_stat_activity
where datname = current_database()
group by application_name, state
order by application_name, state;
If idle keeps climbing after traffic drops, I look for leaked clients or too many processes. If active is high and CPU is high, the pool is not the bug; the queries are. The Node.js performance checklist is the next place I go.
My default production checklist
- One pool or Prisma Client per Node process.
- No pool creation inside request handlers.
- Pool max calculated from all replicas and workers.
- 20 percent of Postgres connections reserved for humans, migrations, and maintenance.
- Connection timeout set; idle timeout set; slow-query logging set.
- PgBouncer or managed pooler in front of serverless or high-process workloads.
- Migration jobs use a separate connection budget and do not run during peak traffic.
- Dashboards show active, idle, waiting, p95 query time, and app replica count.
FAQ
What should my Node.js Postgres pool size be?
Start at 5-10 per process for most APIs. Then multiply by every process and replica. If the total gets close to Postgres max_connections, reduce pool size or add PgBouncer before raising the database limit.
Should I use PgBouncer with Node.js?
Yes when you run many app processes, serverless functions, or autoscaled replicas. For a single VPS with one Node process, pg.Pool is usually enough.
Does Prisma need PgBouncer?
Not always. Prisma has its own pool. PgBouncer helps when process count grows or serverless creates connection churn, but transaction pooling must be tested against Prisma features you use.
Why not set Postgres max_connections very high?
Every connection costs memory and scheduling overhead. High connection counts can make the database slower while hiding the real issue: too many app processes, slow queries, or missing pooling.
How do I know if the pool is too small?
Pool wait time rises while Postgres CPU and active query count are still reasonable. If Postgres is already saturated, a bigger pool makes the queue move from your app into the database and usually worsens p99.
What ships next
This is the connection layer. The next database pieces worth splitting out are Prisma migrations in production, transaction boundaries, and row-level security for multi-tenant APIs. If your pooling problem only shows up during deploys, pair this with the DigitalOcean deployment guide and the Docker guide.